Gold and silver both enter the new week after strong rebounds, but the two charts are not equally convincing. Gold price pumped about 5.2% last week, its best weekly performance since August,
Gold and silver both enter the new week after strong rebounds, but the two charts are not equally convincing.
Gold price pumped about 5.2% last week, its best weekly performance since August, and is up again today near $4,100. Silver also finished last week higher and is trading around $52.20 after recovering from the $49 area.
The divergence with crypto is notable.
Bitcoin and major altcoins remain under pressure after another liquidation-heavy selloff, yet gold is rising as investors respond to softer oil prices, a slightly weaker dollar and ongoing uncertainty across risk markets.
Gold Price Analysis: $4,120 Is the First Test
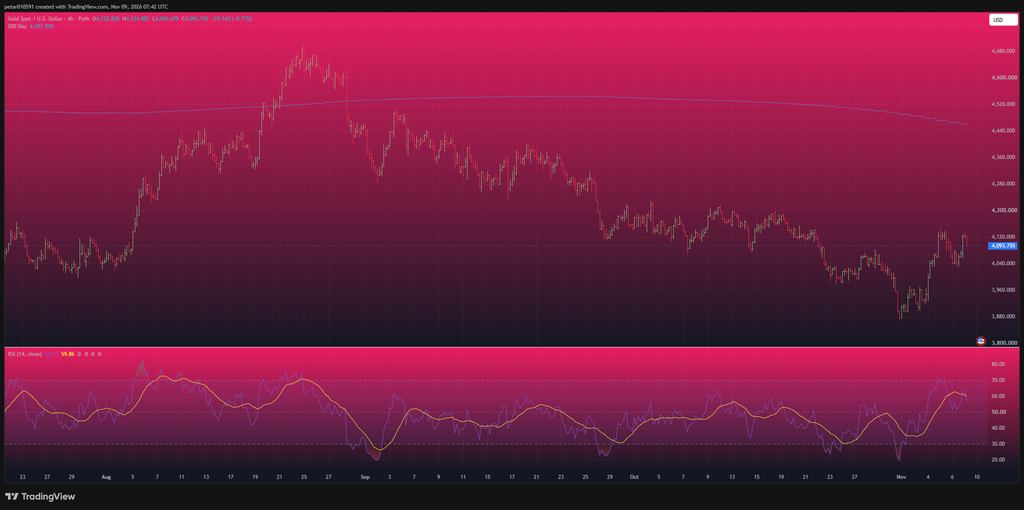
The 4-hour gold chart has improved materially from the late-October low near $3,880.
Price rebounded quickly through $4,000 and is now trading around $4,094 on the attached chart.
The most important technical feature is that gold is no longer making fresh lower lows.
Instead, price has built a short-term recovery structure between roughly $4,040 and $4,120.
RSI is around 56, with its moving average close to 60.
That is constructive without being overbought.
Source: TradinigView
The chart also shows gold trading far below the 200-day average near $4,458, so the larger trend still has plenty of damage to repair.
For today, the first resistance area is $4,115-$4,125.
A clean break above that zone would put approximately $4,160-$4,200 back in play.
Support sits around $4,050, followed by the psychological $4,000 level.
My base case for gold today is a range between roughly $4,060 and $4,140, with a mild bullish bias as long as $4,050 holds.
A stronger move above $4,125 could extend toward $4,170-$4,200.
If sellers push price back below $4,050, another test of $4,000 becomes much more likely.
Read also: Analyst Warns Of Brutal Gold Price Drop To $3,300 As Concerning 50-Year-Old Pattern Returns
Silver Price Analysis: Recovery Is Real, But Resistance Is Close
Silver’s chart is more complicated.
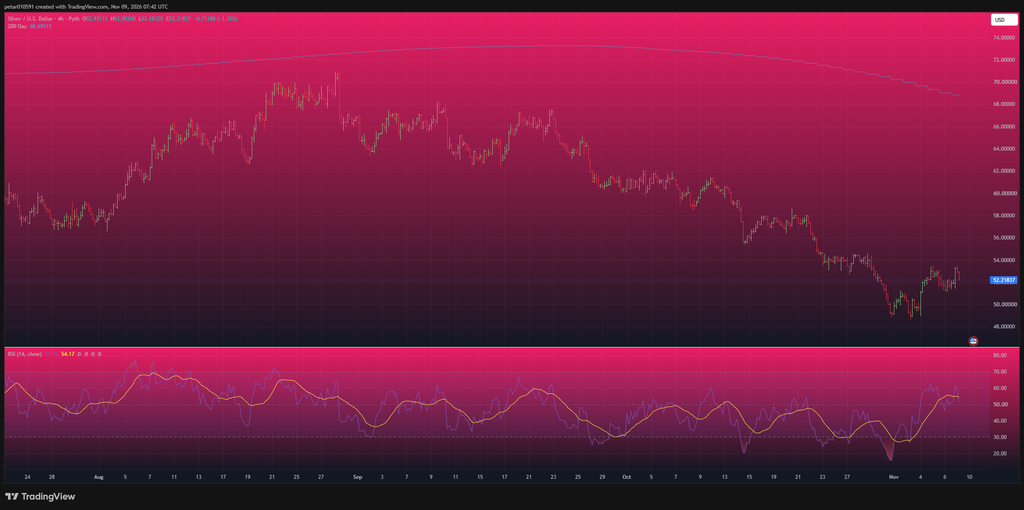
Price has recovered from approximately $49 to around $52.20, but the broader 4-hour structure still shows a clear sequence of lower highs since the August peak near $70.
The current bounce has pushed RSI back toward neutral.
RSI is around 52, with its signal line near 54, meaning momentum has recovered significantly from oversold levels but has not yet turned decisively bullish.
The larger obstacle is overhead resistance.
Silver first needs to clear roughly $53-$54.
Source: TradinigView
That region has rejected price several times recently and sits directly above the current consolidation.
A move through $54 would improve the short-term structure and put approximately $56-$58 back into focus.
Support is easier to identify.
The first area sits around $51-$51.50.
Below that, $49-$50 becomes critical because it contains the recent local bottom.
My base case for silver today is approximately $51-$54.
A bullish breakout through $54 could extend toward $55.50-$56.50.
If $51 fails, however, silver could quickly revisit $49-$50.
Gold therefore has the cleaner chart today.
Silver is recovering, but it still needs to prove it can break the descending sequence that has controlled price for months.
Read also: Silver Price Prediction: Analyst Maps a Path to $70 Before Year-End
Gold and Silver Price Predictions for November 9
Asset
Base case
Bullish case
Bearish case
Gold
$4,060-$4,140
$4,140-$4,200
$4,000-$4,060
Silver
$51-$54
$54-$56.50
$49-$51
The probabilities are not dramatically skewed in either direction, but I would give gold a slightly stronger bullish bias than silver today.
Gold’s recovery is holding better, momentum is healthier, and current macro conditions are offering more direct support.
What Could Move Gold and Silver This Week?
The biggest scheduled catalyst is U.S. inflation.
Consumer-price data is due Tuesday, followed by producer inflation on Friday. Hotter inflation would strengthen expectations that the Federal Reserve could raise rates again in December, which would usually support the dollar and pressure precious metals.
Markets currently assign roughly a 79%-81% probability to a December Fed rate increase after the stronger October jobs report.
Oil is another important variable.
Crude prices have fallen after President Trump indicated further U.S. attacks on Iran may be unlikely if negotiations continue. Lower energy prices reduce inflation pressure, which is one reason gold is rising today.
Finally, investors are still watching the technology-stock selloff.
If risk appetite deteriorates again, gold could benefit from defensive flows even if crypto and equities continue falling. Silver is more complicated because of its industrial exposure, which can make it less defensive than gold during deeper growth scares.
For November 9, that leaves a fairly clear setup.
Gold needs to clear $4,125 to extend its rebound.
Silver needs to break $54.
Until those levels fall, both metals are recovering, but neither has fully confirmed the next leg higher.
For more financial news and price predictions, click here.
Subscribe to our YouTube channel for daily crypto updates, market insights, and expert analysis.
The post Gold and Silver Price Predictions for Today (November 9) appeared first on CaptainAltcoin.