Global gold demand is making a big comeback after a weak stretch in the middle of the year. Physical gold-backed ETFs posted +$3.0 billion in net inflows during July , the largest monthly int
Global gold demand is making a big comeback after a weak stretch in the middle of the year.
Physical gold-backed ETFs posted +$3.0 billion in net inflows during July , the largest monthly intake since April. That inflow added +23 tonnes to global ETF holdings, bringing the total to 4,068 tonnes – just shy of the all-time high of 4,176 tonnes set on February 27.
European funds led the rebound with +$2.1 billion , followed by Asia at +$600 million and North America at +$71 million. The reversal is particularly notable after May and June produced -$2 billion and -$9 billion in outflows, respectively. Year-to-date, global gold ETFs have now attracted +$11.0 billion in inflows, confirming that the metal is once again attracting capital after months of selling pressure.
Gold Chart Analysis: Breakout from a Multi-Week Base
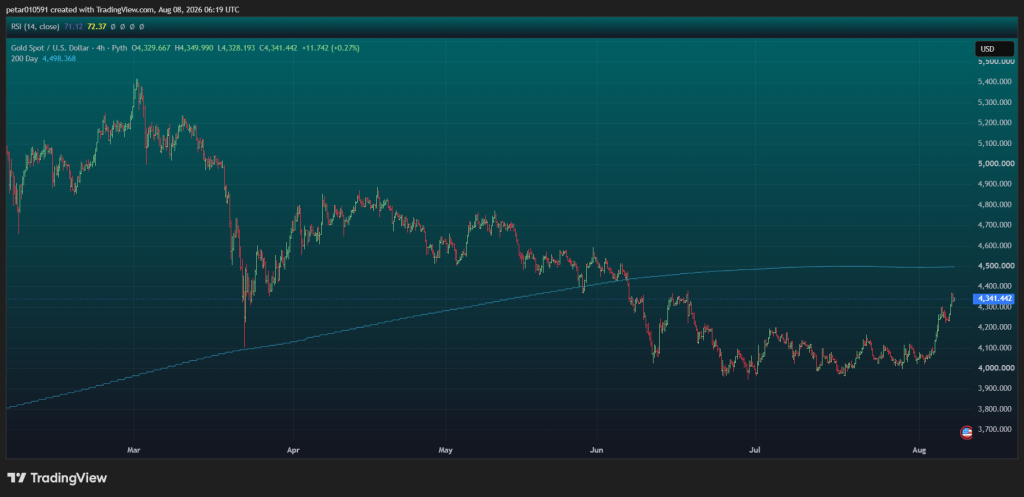
Gold peaked near $5,400 in late February or early March, then broke down hard into April, briefly spiking to a low wick around $4,300 before stabilizing. April and May brought choppy consolidation in a $4,600–$4,900 range. June and July saw a steady grind lower into a $4,000–$4,200 base , with price spending roughly 6–7 weeks range-bound there.
Late July into August produced a big breakout rally from roughly $4,000 to the current $4,341–$4,350 area . Price is still trading below the 200‑day moving average (~$4,498) , which now sits as the next major overhead level. The RSI (14) is at 71–72 , in overbought territory, consistent with the strength of the recent move.
 Source: TradingView
What’s Driving the Recent Gold Pump
The pump is backed by real macro catalysts, not just technical momentum:
- A weak July U.S. jobs report (a loss of 23,000 jobs vs. roughly 80,000 expected) heavily raised expectations for a Fed rate cut at the September meeting, which is bullish for non-yielding assets like gold
- Gold opened over $4,300 an ounce for the first time since June 17 on progress in reopening the Strait of Hormuz, alongside softer ADP job numbers
- Persistent inflation concerns, central-bank buying, and renewed friction around Iran and the Strait of Hormuz have added to safe-haven demand
- Gold is up about 6.75% over the past month and 28% year-over-year as of August 7
Also, gold stocks pumped more than 20% this week, raising the question of what that signals for the weeks ahead.
Historically, one‑week gains of 15% or more following a deep decline have been a strong bullish indicator, often indicating that a bottom is in place. These rallies tend to be bearish only when they occur after a major advance, not after a steep selloff.
Gold stocks were even more oversold on a long‑term basis in 2008 and 2016, and less so in 2020. In each of those cases, explosive one‑week rallies marked the beginning of a powerful recovery. Some backing and filling is possible, but the lows are likely already in.
What the Gold Chart Tells Us
This is a genuine breakout out of a multi-week base. The move from $4,000 to $4,350 is a clean, decisive advance on real news catalysts, not just noise.
RSI in the low 70s is a caution flag for a 4‑hour timeframe. It does not invalidate the trend, but it does raise the odds of a near-term pause, pullback, or consolidation before any push toward the 200‑day MA at $4,498. If it does clear $4,498, that reopens the path toward the prior swing highs in the $4,700–5,000 zone . Failure there could send it back toward the $4,000–4,100 base that just held.
The Tricky Part: Buying After a 7% Weekly Pump
It is tricky to buy gold after a pump of over 7% in one week. Sellers might now step in to take profits. RSI in the low 70s indicates the rally may be overextended in the short term, and a pullback or consolidation would be healthy before any further advance.
That said, momentum does look strong. The macro catalysts are real: weak jobs data, falling yields, geopolitical uncertainty, and central-bank buying. The breakout from the $4,000 base is technical confirmation that buyers have regained control after months of selling.
For now, the setup is constructive, but the risk-reward at current levels is less attractive than it was two weeks ago near $4,000. Patience and waiting for a pullback to support may offer better entry points.
Subscribe to our YouTube channel for daily crypto updates, market insights, and expert analysis.
The post Gold Price News: Global Gold Demand Is Rapidly Recovering appeared first on CaptainAltcoin.