Gold is still under pressure. It slipped below the key $4,000 level and is hanging near its lowest point in seven months. A stronger dollar, higher Treasury yields, and steady selling have ke
Gold is still under pressure. It slipped below the key $4,000 level and is hanging near its lowest point in seven months. A stronger dollar, higher Treasury yields, and steady selling have kept the pressure on all week.
The gold price bounced around a wide range for a few days. It tested support near $3,940, then saw small intraday rebounds that never changed the bigger picture.
That leaves the market at a critical point. A clean break below $3,940 could open the door to $3,850. Also, buyers need to take back $4,060–$4,096 before confidence can start to come back. One analyst thinks there’s more downside ahead, with targets below $3,900 still very much in play.
Gold Price Analysis: Why the Chart Still Favors Sellers
We had a look at the chart shared by Itsadiee_Fx and sellers still have the upper hand after the XAU price failed to recover the $4,000 level.
The chart shows a clear pattern: lower highs ever since the June peak above $4,080. Every bounce gets sold. Gold is trading around $3,986, and the downtrend is still intact.
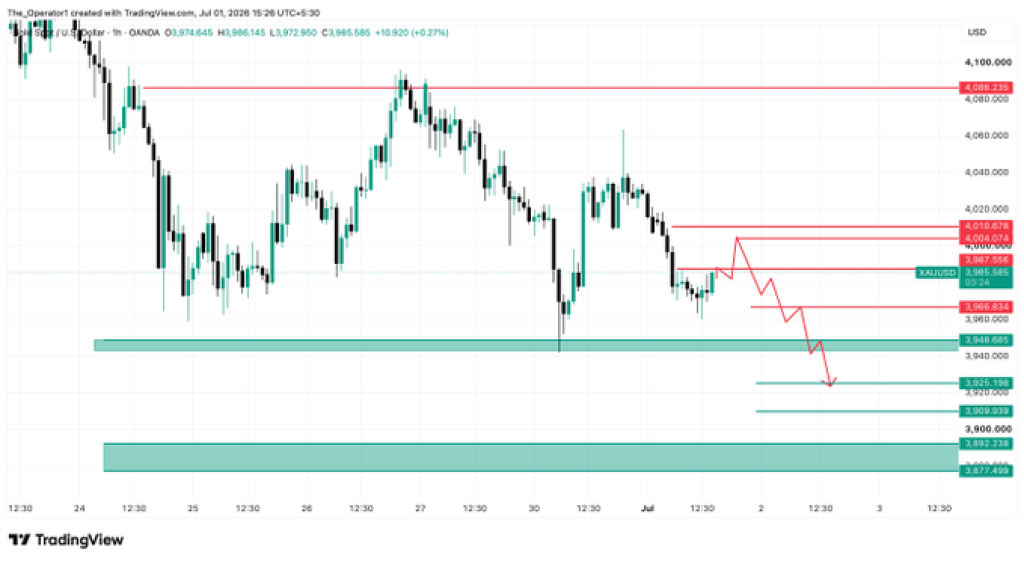 Source: X/Itsadiee_Fx
First resistance is at $4,007, then $4,011, with the big one at $4,086. The projected path suggests a small bounce toward that $4,007–$4,011 area before another drop. If sellers hold that zone, attention goes back to $3,966, the first support below.
If $3,966 breaks, the next floor is around $3,948–$3,950. And if that gives way, the gold chart points to $3,925, then $3,909, and finally $3,877.
A move back above $4,011 would ease the immediate pressure. But gold would still need to take back $4,086 before buyers can really claim control of the bigger picture.
Analyst Explains Why Every Gold Rally Has Failed
Market analyst Itsadiee_Fx believes Gold’s behavior changed completely during June. In previous months, strong buying sessions often led to continued gains or healthy retracements.
Over the past month, however, every bullish move has eventually failed, even after aggressive buying volume or liquidity sweeps. In the analyst’s view, that pattern shows the market is no longer rewarding buyers.
The analyst compares today’s environment with January 2026, when Gold remained in a powerful uptrend and buyers controlled nearly every trading session. June has produced the opposite result. Sellers have dominated the market, recovery attempts have faded quickly, and many traders entering fresh long positions have found themselves trapped as the decline resumed.
That bearish view stays in place unless the gold price can get back above $4,086. The analyst expects any bounce toward $4,010 to draw in some buyers, but only before another round of selling kicks in. From there, the downside levels to watch are $3,924, then $3,909, and finally the $3,892–$3,877 zone if support near $3,950 gives way.
Related Gold News: Gold Crashed 29%, Silver Lost Half Its Value, but Robert Kiyosaki Thinks the Biggest Move Is Next
Key Events That Could Move Gold Price This Week
The big one lands Thursday, July 2. The U.S. drops its June jobs report a day early because of the Independence Day holiday. Economists are looking for payroll growth around 80,000, down from May’s 172,000, with unemployment holding near 4.3%.
If the number comes in hotter than expected, the dollar could strengthen and push gold lower. A weaker read could help gold climb back above $4,000.
Investors will also be listening to Fed Chair Kevin Warsh. The Fed kept rates at 3.5%–3.75% in June, so everyone’s watching for any hint about what comes next. If he leans toward tighter policy, Treasury yields would likely rise and bullion would feel more weight.
Before that, traders get Wednesday’s ADP jobs report and ISM manufacturing data. Strong hiring or better factory numbers would back up the idea that the U.S. economy is still solid, good for the dollar, bad for gold. Soft numbers, though, could bring in bargain hunters after gold’s big drop.
Our Take: Is Gold Really Headed Below $3,900?
Gold lost that big $4,000 mark, and the chart still leans bearish. Price action keeps pointing toward that $3,924–$3,877 support zone. Unless buyers can take back at least $4,010, and eventually $4,086, the larger trend stays tilted down.
That said, the next couple of trading days could decide a lot. Thursday’s employment report and fresh signals from the Federal Reserve have the potential to change market sentiment quickly.
If economic data weakens, the gold price could stage a recovery above $4,000. If the data beats expectations, the analyst’s bearish targets below $3,900 become much more realistic.
Frequently Asked Questions
Will gold hit 10,000 USD
Yes, some prominent analysts and economists believe gold could reach $10,000 per ounce before the end of the decade, typically projecting it between 2028 and 2029. However, achieving this milestone would require severe macroeconomic or geopolitical triggers.
Why is gold crashingA combination of a strong dollar, hawkish Fed expectations, the Japanese yen collapse, and a technical breakdown below $4,000. The safe‑haven bid has faded as geopolitical tensions ease.
Subscribe to our YouTube channel for daily crypto updates, market insights, and expert analysis.
The post Gold Price Prediction: Analyst Warns XAU Could Crash Below $3,900 This Week appeared first on CaptainAltcoin.