Gold price is having a great week. The metal is now trading above $4,300 per ounce after pumping roughly 7% this week. We reported a few times this week on the reasons behind gold’s strength:
Gold price is having a great week. The metal is now trading above $4,300 per ounce after pumping roughly 7% this week.
We reported a few times this week on the reasons behind gold’s strength: a weaker US dollar, falling Treasury yields, a weak July jobs report that raised expectations for Fed rate cuts, and continued geopolitical uncertainty around Iran and the Strait of Hormuz.
Now, another major catalyst has arrived.
China’s Central Bank Adds 20 Tonnes in July
China’s central bank just made its largest monthly gold purchase in nearly three years. The institution added +20 tonnes of gold to its reserves in July, marking the biggest single-month increase since October 2023. The purchase follows acquisitions of +15 tonnes in June and +10 tonnes in May, extending the country’s buying streak to 21 consecutive months.
Year-to-date, China has now added +60 tonnes of gold to its official reserves, pushing total holdings to a record 2,366 tonnes. The scale of accumulation places the country among the most aggressive sovereign buyers in the world.
Behind the numbers, a logistical shift is also underway. China’s central bank has reportedly been moving a portion of its gold reserves from London to Hong Kong. The relocation is seen as a strategic move to support Hong Kong’s ambition to become a major global gold-trading hub. A new gold-clearing system is set to launch in the city as part of that push.
China’s appetite for gold remains incredibly strong, and the country is positioning itself for a larger role in the global gold market. The combination of record reserve levels and physical relocation indicates the buying is more than just a hedge.
Gold Chart Analysis: A Decisive Pump
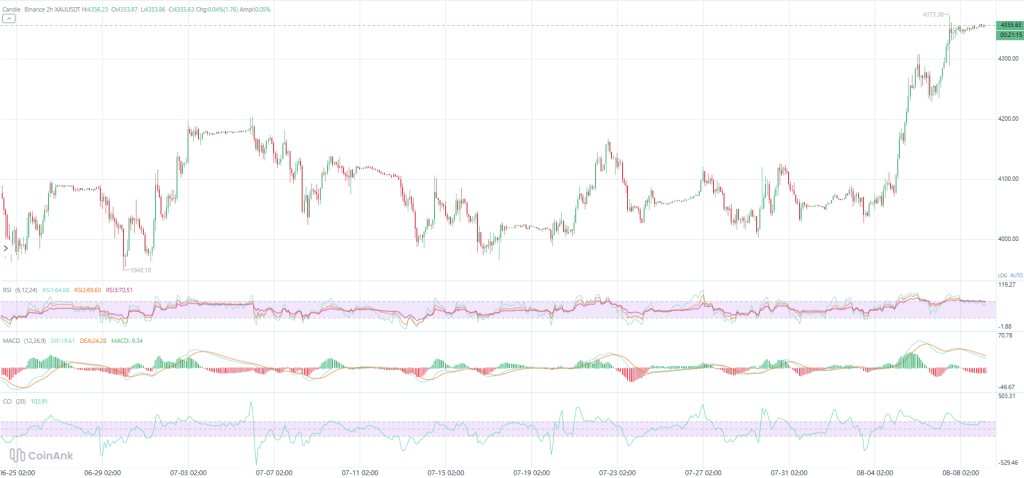
The 4‑hour chart tells a story of a market that has finally broken out of a multi‑week trading range.
Gold Price Action
Gold oscillated in a $4,050–$4,130 range in late June before a big flush down to a swing low of $3,948 – a fast liquidity grab. That was followed by a strong bounce into a $4,180–$4,230 consolidation band in early July.
 Source: CoinAnk
A grinding downtrend from roughly $4,230 back to the $3,990–$4,020 zone followed in mid‑July, with sideways chop between $4,000–$4,100 through July 22. A rally attempt to roughly $4,180 in late July failed, and price rotated back down into a broad $4,070–$4,150 range that persisted through August 3.
Then came the breakout. From August 4 to 8, a sharp, high‑momentum impulse pushed price from roughly $4,100 to a high of $4,373.38 , before a modest pullback to the current price of $4,356.17. This is by far the strongest directional move on the chart.
Support & Resistance Zones
- Resistance: $4,373.38 (the fresh swing high) is immediate resistance. A break above it opens further upside with no prior structure to cap it.
- Support (near‑term): $4,300–$4,320, formed by the most recent consolidation candles right below the highs.
- Support (structural): $4,100–$4,150 — the multi‑week base the breakout launched from. A retrace back into this zone would question the breakout’s validity.
- Deeper support: $4,180–$4,230 (prior early‑July high) and $3,990–$4,020 (mid‑July range floor).
- Major support: $3,948, the extreme swing low — unlikely to be tested without a significant reversal.
All three RSI lines are elevated: RSI1 at 66.07, RSI2 at 69.91, and RSI3 at 70.61, clustered near the 70 overbought threshold. This confirms the strength of the recent rally but also signals the move is stretched.
The MACD histogram has turned negative even though price is near its highs. This is a caution flag: short‑term momentum is cooling after the initial breakout thrust, which often precedes a pause or shallow pullback rather than an immediate reversal.
The CCI sits at 106.09, above the +100 line – consistent with a strong trend in place.
Read more Gold news: Tether’s Gold Holdings Double in 18 Months
Gold Price Prediction: Where to From Here?
The dominant story is a decisive breakout from a multi‑week base. Gold has cleared the $4,150 resistance that held it down for weeks, and the momentum is clearly bullish.
That said, the market is stretched. RSI near 70 and a flattening MACD suggest the immediate thrust may be losing steam. A pause or shallow pullback to the $4,300–$4,320 zone would be a healthy way to digest the rally before any further advance.
The bullish case: If the gold price holds above $4,300 and consolidates, the next target is the 200‑day moving average near $4,480–$4,500. A weekly close above that level would re‑open the path to the $4,700–$5,000 zone from earlier this year.
The bearish case: If the gold price fails to hold $4,300 and retreats back below $4,150, the breakout would be called into question. A move back to $4,000 would not be surprising in that scenario.
What I’m watching: The $4,300 level is the new line in the sand. Holding above it keeps the bullish momentum intact. Losing it could trigger a quick pullback toward $4,150 before buyers step back in.
Subscribe to our YouTube channel for daily crypto updates, market insights, and expert analysis.
The post Gold Price Prediction as China’s Central Bank Makes Largest Gold Purchase Since October 2023 appeared first on CaptainAltcoin.