Gold holders should have nothing but smiles on their faces in the past 10 days or so. The price pumped from around $4,000 to roughly $4,400 at press time – a 10% move, which is a big pump for
Gold holders should have nothing but smiles on their faces in the past 10 days or so. The price pumped from around $4,000 to roughly $4,400 at press time – a 10% move, which is a big pump for gold.
The metal has been on a strong recovery run, breaking out of a multi-month base and testing key resistance levels. The question now is whether the gold rally has legs or if sellers will step in near the 200-day moving average.
Retail Investors Are Rushing Back Into Gold
The Kobeissi Letter reported a big change in retail sentiment.
The largest US physical-gold-backed ETF, GLD , attracted +$50 million in retail inflows on Wednesday , the largest daily inflow since March. That was also twice the previous largest daily inflow recorded since early April.
Overall, GLD attracted +$637 million in inflows on Wednesday , the largest daily inflow since June 18. The fund then posted +$77 million and +$431 million in inflows on Thursday and Friday, respectively.
So far in August, investors have added +$1.4 billion to GLD, putting the ETF on track for its first monthly inflow since February.
Investor appetite for gold is back.
Gold Chart Analysis – Weekly Timeframe
The weekly gold chart tells a story of a market that blew off, corrected, and is now recovering.
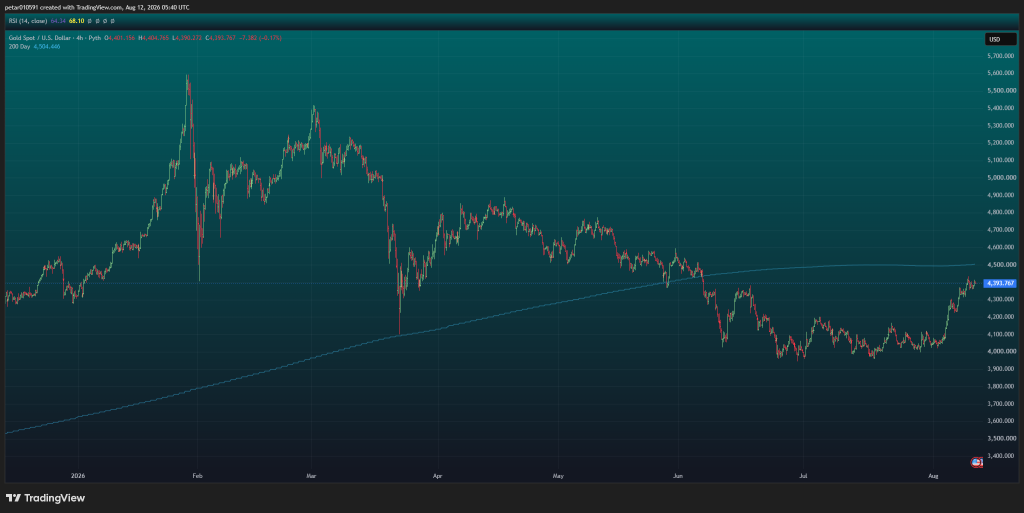
January 2026 began with consolidation between roughly $4,300 and $4,450, a fairly tight base to start the year. Late January brought a violent, fast spike to a high near $5,600 , followed almost immediately by an equally violent crash back down to roughly $4,400 within days. This is a classic blow-off and flush pattern – likely a news-driven spike or flash event, not organic trend continuation.
 Source: TradingView
February to March saw a choppy rally back toward roughly $5,400–$5,450, failing to reclaim the January highs – a lower high versus the initial spike. April brought a sharp decline from roughly $5,300 down to a swing low near $4,100 , another fast capitulation-style drop.
April to May produced a bounce back to roughly $4,900, then rolled over again. May to June had a steady grind down to a range low around $4,000–$4,050. June to July featured extended consolidation between roughly $4,000–$4,200 – the longest sideways base on the chart, building a floor.
Late July to August has brought a strong recovery push from roughly $4,050 back up to current price $4,393.77 , breaking back above the long-term rising trendline in the process.
Gold price: key Levels:
- Current price: $4,393.77 (down -0.17% on the day)
- 200-day MA: $4,504.45 – sitting above current price, making it the key overhead resistance. Price has not reclaimed this since the June breakdown.
- Rising trendline (light blue): Drawn from the January base through the multi-month decline, currently sitting almost exactly at and just below current price. Price is testing and reclaiming this trendline as support after spending May to July below it.
- Immediate resistance: $4,450–$4,500 zone (January consolidation range + 200-day MA confluence)
- Support: $4,200–$4,300 (recent breakout base), then $4,000–$4,100 (the June range floor)
The chart’s dominant story right now: price has clawed back above its rising trendline and is pressing into the 200-day MA – a genuine test of whether the broader downtrend since February is over.
Read also: Gold and Silver Prices Post Their Strongest Week in Months: What to Expect Next
Weekly Indicator Panel
IndicatorValueSignalInterpretationADX (14)40.73BuyStrong trend in placeWilliams %R-45.76NeutralMid-range – no extremeCCI (14)42.80NeutralNo strong momentum extremeATR (14)221.85Less VolatilityWeekly ranges have compressedHighs/Lows (14)30.79BuyHigher highs and higher lowsUltimate Oscillator59.96BuyBuying pressure across multiple timeframesROC-6.80SellNegative rate of change – lagging from earlier declineBull/Bear Power (13)170.87BuyBulls in clear control
Aggregate read: 5 of 8 indicators lean Buy, 2 are Neutral, and only ROC is flatly bearish. That ROC “Sell” is worth flagging – it is a lagging reflection of the multi-month drawdown from the January highs rather than a signal about current momentum, since every other momentum and trend metric is already flipping bullish.
Gold Price Prediction (Short-Term)
The chart and the weekly indicators tell a fairly consistent story. The gold price spent February through June in a corrective downtrend after the January blow-off and crash, found a base around $4,000–$4,100, and has staged a genuine recovery back above its rising trendline.
The weekly indicator panel largely confirms this – strong trend strength (ADX), broad-based buying pressure (Ultimate Oscillator, Bull/Bear Power), and a pattern of higher highs and higher lows – with the lone bearish holdout (ROC) reflecting stale medium-term weakness rather than current conditions.
The key test ahead is the 200-day MA at $4,504. Reclaiming and holding above that level would confirm the recovery has real strength and could open the way back toward the $4,700–$4,900 zone. Failure there, combined with the “Less Volatility” ATR reading (often a precursor to a volatility expansion in either direction), keeps a rejection back into the $4,200–$4,300 base a real possibility.
Bullish scenario: Gold breaks and holds above $4,500. Next targets are $4,700 and then $4,900. The retail inflows and ETF demand support this view.
Neutral scenario: Gold consolidates between $4,300 and $4,500. A pause to digest the 10% rally would be healthy. This is the most likely outcome in the short term.
Bearish scenario: Gold fails at the 200-day MA and drops back toward $4,200–$4,300. A break below $4,200 would open the door to $4,000.
Overall, the $4,500 level is the line in the sand. The gold price has not closed above the 200-day MA since June. A break above that level would be the strongest bullish signal in months. A rejection would send gold back toward $4,200.
For gold and crypto news and price predictions from CaptainAltcoin, click here.
Subscribe to our YouTube channel for daily crypto updates, market insights, and expert analysis.
The post Gold Price Prediction as Retail Investors Rush Back Into Gold appeared first on CaptainAltcoin.