Gold is bouncing back after yesterday's CPI-driven dip. XAU/USD is trading at $4,155.22, up 1.23% today, after a candle that dipped to $4,099.76 before recovering to a high of $4,161.98. That
Gold is bouncing back after yesterday's CPI-driven dip. XAU/USD is trading at $4,155.22, up 1.23% today, after a candle that dipped to $4,099.76 before recovering to a high of $4,161.98.
That rebound comes even as the daily chart shows a bearish EMA crossover, where the shorter-term average recently slipped below the longer-term one, a signal some traders read as a caution flag.
This Gold Price Prediction breaks down the news and the chart together.
Gold News Today: CPI Inflation Rise and a Central Bank Demand Signal
Two separate reads on gold circulated recently.
A post from The Kobeissi Letter on X said gold fell toward $4,100 per ounce after US CPI inflation data came in at 3.7%, hotter than expected, pressuring the metal since higher inflation prints can reduce near-term rate-cut expectations.
Separately, a market commentary piece pointed to gold finding strong buying support near $4,000, citing vibrant central bank buying and a pullback in the 10-year Treasury yield, the return investors demand to hold US government debt for ten years is from a 5.35% resistance area toward 5%.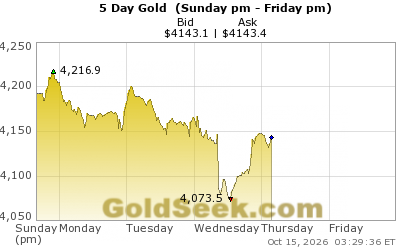
Source: Data From X
It asked whether gold could reclaim $4,200 before the week closes. Both are single-source reads CoinGabbar could not independently verify in full.
Gold Technical Analysis
Gold price today is trading at $4,155.22, up 1.23% on a candle that opened at $4,106.06 and ranged between $4,099.76 and $4,161.98, recovering from the CPI-driven dip within the same session.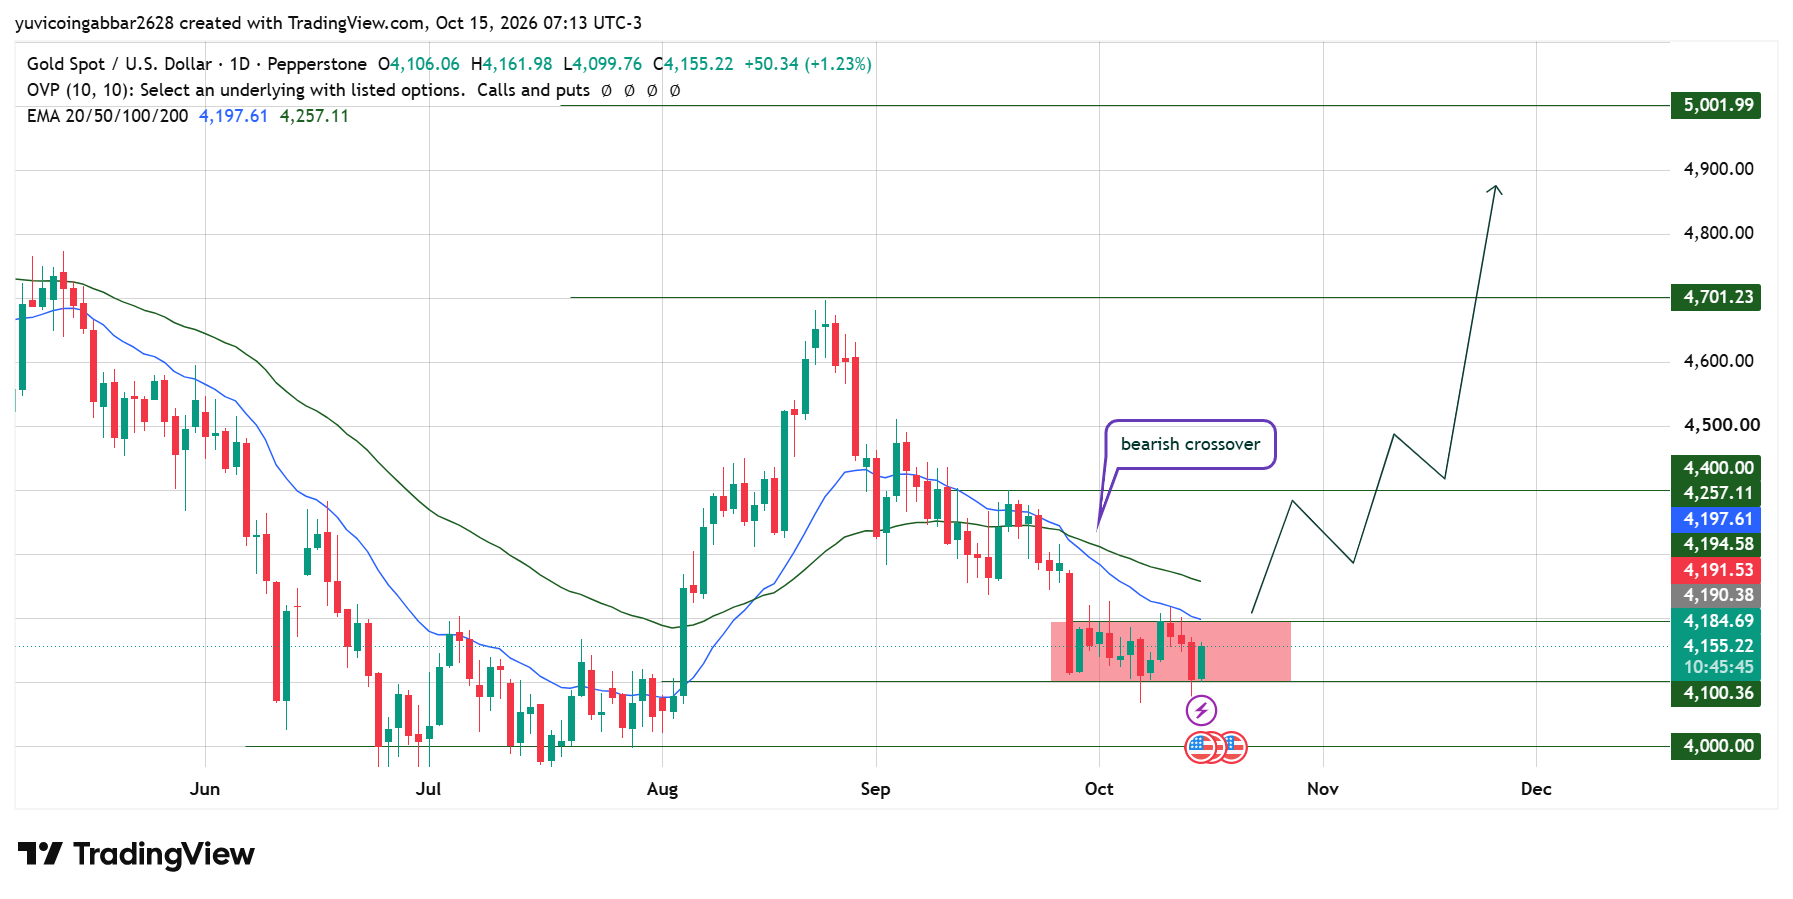
The chart marks a bearish crossover, where the 20 EMA near $4,197.61 recently crossed below the 50 EMA near $4,257.11, a pattern that can signal weakening short-term momentum even during a bounce like today's.
Price has been consolidating in a zone roughly between $4,100 and $4,185 since early October.
Clearing the EMA cluster near $4,197.61 to $4,257.11 would be the first test, with $4,701.23 and $5,001.99 marked as the chart's longer-term targets if that happens.
A slide back below $4,100.36 would put today's bounce in question, with $4,000.00 as the next level down.
Gold Forecast: Key Levels to Watch
The daily chart shows gold consolidating inside a marked range between approximately $4,100.36 and $4,184.69. This zone is important because a confirmed breakout or breakdown could help define the next directional move.
Technical Level
Price
Immediate resistance
$4,184.69
Key psychological resistance
$4,200
EMA 20
$4,197.61
EMA 50
$4,257.11
Major resistance
$4,400
First support
$4,100.36
Major support
$4,000
Upside target 1
$4,701.23
Upside target 2
$5,001.99
Gold Price Scenarios: Bull, Base, and Bear Case
Bull case: A close above the 4,197.61–4,257.11 EMA zone would suggest the bearish crossover is being overridden, opening a path toward $4,701.23 over time.
Base case: Gold continues consolidating between $4,100 and $4,185 while the market weighs the CPI print against central bank demand.
Bear case: A close below $4,100.36 would put today's bounce in question and shift focus back toward $4,000.00.
Support
$4,100.36 is the nearer support from today's consolidation zone; $4,000.00 is the deeper level tied to central bank demand.
Resistance
The $4,197.61 to $4,257.11 EMA cluster is the first hurdle. Clearing it opens the path toward $4,701.23, then $5,001.99 further out.
Gold Price Prediction: Can XAU/USD Still Reach $4,200 This Week?
Possible, but not confirmed. Gold would need to clear the EMA cluster just above $4,200 first, something it hasn't done since the bearish crossover formed.
Today's bounce is a step in that direction, but one day's move isn't enough on its own to say the crossover has been overridden.
Gold Outlook: Gold Holds Near $4,100 Support
Gold is attempting to stabilize near the $4,100 level after a prolonged decline on the daily chart. On October 15, 2026, XAU/USD traded around $4,155.22, gaining 1.23% in the session shown on the chart. However, the recovery faces resistance from the nearby $4,184.69 zone and the moving averages above the current price.
Recent market commentary highlights elevated US inflation, with a separate post reporting annual CPI inflation at 3.7%. Meanwhile, the provided market commentary points to central bank buying and demand as potential sources of support for gold.
These factors may influence sentiment, but price confirmation remains important.
The key question is whether gold can reclaim $4,200 and build enough momentum to challenge higher resistance levels, or whether sellers will push prices back toward $4,100 and $4,000.
XAU/USD Prediction: Can Gold Price Reach $4,700 and $5,000?
A bullish scenario depends on gold breaking above the current consolidation range and holding the reclaimed levels.
If XAU/USD clears $4,200 and moves through the higher resistance zone near $4,400, the next major chart target is $4,701.23. A sustained move beyond that level could bring the $5,001.99 target into focus.
However, these are conditional technical targets, not guaranteed outcomes. Gold would need to overcome multiple resistance zones before the higher levels become realistic.
The immediate confirmation signal is a sustained breakout above $4,184.69 to $4,200, rather than a brief upward spike.
Gold Price Prediction 2026: Expert Analysis
According to CoinGabbar analysts, Today's recovery from $4,099.76 is encouraging, but the bearish EMA crossover is the detail worth watching most closely.
$4,197.61 is the level that would need to clear for the chart to look like it's shaking off that signal rather than just bouncing within the recent range. This read is based on the daily chart levels above.
Disclaimer
This article is for informational purposes only and isn't financial advice. Gold and commodity markets can move sharply on macro news. Always do your own research before making any trading decisions.