Gold lost more than 6% in September, yet one of its largest buyers reportedly increased its purchases during the same month. That contrast shapes this gold price prediction. A falling price a
Gold lost more than 6% in September, yet one of its largest buyers reportedly increased its purchases during the same month.
That contrast shapes this gold price prediction. A falling price and rising demand rarely point in the same direction for long.
Gold has served as a store of value for thousands of years, and central banks still hold it as a core reserve asset. Investors usually follow it through the spot price quoted in US dollars, known as XAUUSD.
The gold price today is $4,128.605 per ounce, up 0.42% on the day. Spot gold has traded between $4,103.445 and $4,143.425 so far.
Anyone searching for a gold price prediction October 2026 outlook will notice that the metal now sits roughly 12% below its late August high near $4,700.
Gold (XAUUSD) Live Market Data
Metric
Value
Price
$4,128.605
Day Change
+$17.275 (+0.42%)
Day Open
$4,112.730
Day High
$4,143.425
Day Low
$4,103.445
RSI (daily)
39.18
Source: TradingView, Gold Spot / U.S. Dollar daily chart, OANDA, October 8, 2026
Gold News Today
The latest gold news comes from a social media post about China. According to the post, China added 740,000 ounces of gold in September, its largest monthly addition in three years. That purchase was worth about $3.1 billion.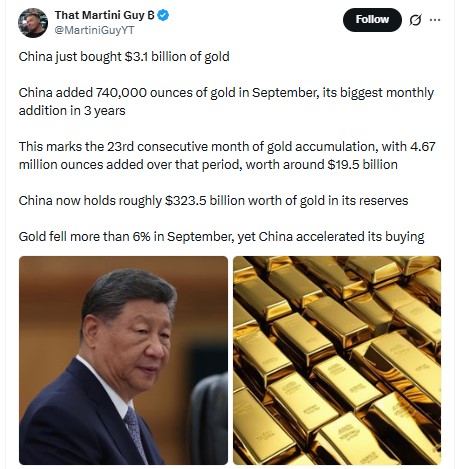
Source: Data Taken From @MartiniGuyYT on X, October 8, 2026.
The post also says this was the 23rd consecutive month of accumulation. Over that span, China reportedly added 4.67 million ounces, worth around $19.5 billion. Its total gold reserves are put at roughly $323.5 billion.
The post adds that gold fell more than 6% in September while China accelerated its buying. It names no data source, and we could not verify the figures independently. Readers should treat them as reported claims.
Gold (XAUUSD) Technical Analysis
The daily chart shows gold above a rising trendline that began at the June low. That line has held through several pullbacks. The price now sits just above it after a fall from the late August high.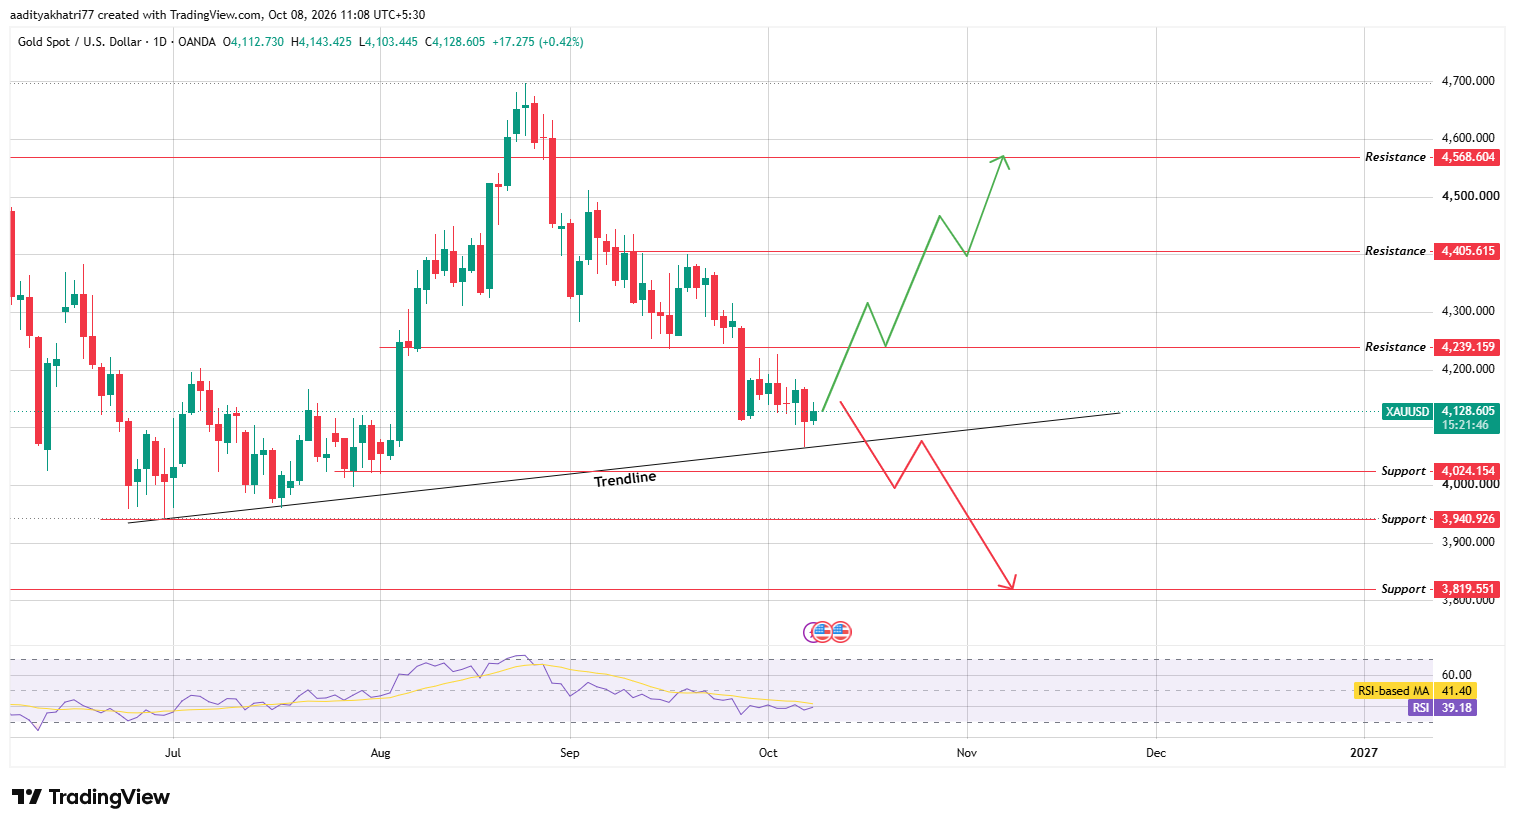
Source: TradingView, Gold Spot / U.S. Dollar daily chart, OANDA, October 8, 2026
The current daily candle is due to close at about 02:30 IST on October 9, which is 21:00 UTC on October 8. The reading can still change before then.
The RSI stands at 39.18, below its moving average of 41.40. That points to soft momentum without an oversold reading. Our gold technical analysis therefore looks for price and volume to confirm any move.
Gold Price Prediction: Can XAUUSD Bounce and Break Resistance?
The bullish case starts with the trendline holding as support. A bounce from there would first meet resistance at $4,239.159, about 2.7% above the current price.
A daily close above that level on volume higher than the 20-day average would be the first confirmation.
If that break holds, the next target is $4,405.615, roughly 6.7% higher. A volume breakout above that level would open the path to $4,568.604, which sits about 10.7% above today's price.
Without strong volume, a move above resistance can fade quickly. A daily close back below the broken level would cancel the bullish setup.
What Happens to Gold If the Trendline Breaks?
The bearish case begins with a daily close below the rising trendline. That alone would show that buyers have lost control of the recent recovery. The first support then sits at $4,024.154, about 2.5% below the current price.
A daily close under that level, with volume above the 20-day average, would point to $3,940.926. That is roughly 4.5% lower and close to the June low. Below it, the next support is $3,819.551, a fall of about 7.5%.
The RSI leaves little room for comfort. It remains under its moving average, so selling pressure has not yet eased.
Price Levels to Watch
These levels come from the daily chart and are judged on closing prices.
Support
Resistance
$4,024.154
$4,239.159
$3,940.926
$4,405.615
$3,819.551
$4,568.604
Bull, Base, and Bear Scenarios
Scenario
Setup
Level
Bull
Daily close above resistance on above-average volume
$4,239.159 to $4,568.604
Base
Price holds the trendline and moves between support and first resistance.
$4,024.154 to $4,239.159
Bear
Daily close below the trendline, then below support, on rising volume
$3,940.926 to $3,819.551
Gold vs the US Dollar
Gold is priced in US dollars, so the dollar often influences it. A stronger dollar makes gold more expensive for buyers in other currencies, and that can weigh on demand. A weaker dollar usually has the opposite effect.
We have no dollar index data for this update, so we make no claim about its current direction. Readers following the gold price forecast should watch the dollar alongside the trendline.
Methodology
This gold price prediction rests on two inputs. The price levels, the rising trendline, and the RSI come from the daily OANDA Gold Spot / US Dollar chart on TradingView, captured at 11:08 IST on October 8, 2026.
The news item comes from a public social media post.
We accept a breakout or breakdown only on a closed daily candle, with volume above the 20-day average. The 20-day average is our own confirmation standard and does not come from the chart.
No separate market data snapshot was available, so the live data table uses the chart candle.
Expert Opinion
General market commentary on central bank buying holds that it supports long-term demand for gold. It does not remove short-term price swings, since traders still react to the dollar, interest rates, and risk sentiment.
Applied to this chart, the view favors patience. A daily close above $4,239.159 would show that buyers are responding to the demand story. A close below the trendline would show that the pullback has more room to run.
Disclaimer: This article is for information only and is not financial advice. Gold prices can fall below every support level listed here, and leveraged trading can lead to losses larger than the amount invested. Technical levels can fail, and no scenario above has a guaranteed probability. Please research independently and invest only what you can afford to lose.