Gold is trading just below $4,400 per ounce after a strong August rally. The metal pushed from roughly $4,000 to over $4,430 earlier this month, marking one of its best performances since the
Gold is trading just below $4,400 per ounce after a strong August rally. The metal pushed from roughly $4,000 to over $4,430 earlier this month, marking one of its best performances since the January peak near $5,600. Spot gold was quoted around $4,376 on August 16, up roughly 3.2% for the week.
The rally has been impressive. But the bigger question is whether this is just a relief bounce or the start of something much larger. One analyst, Jordan, shared a gold chart that argues the recent correction may actually be a buying opportunity, not a warning sign.
Jordan tweeted:
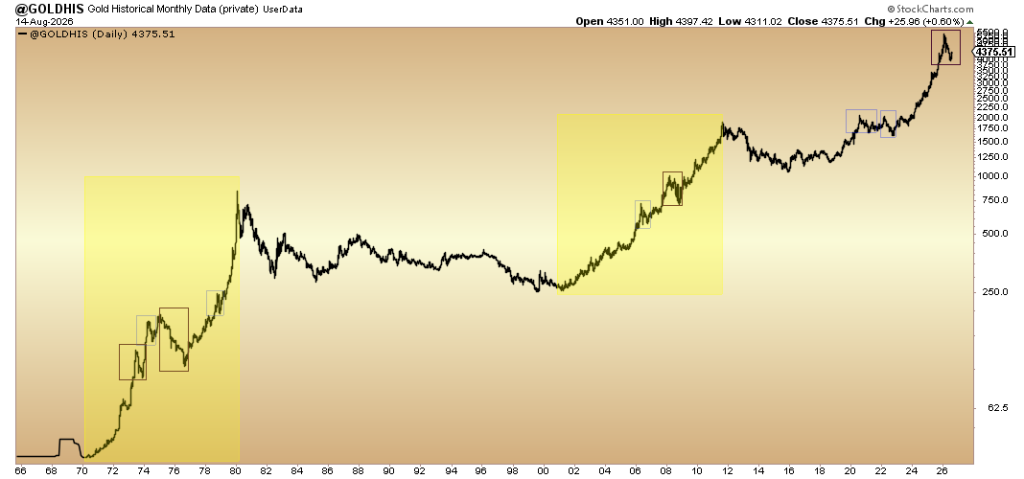
“The boxes mark 20% declines during secular bulls in Gold. Gold’s recent pullback was nearly identical to 1973 and modestly smaller—in both price and duration—than 2008. Gold is not yet at the comparable 1975 stage of a secular bull market and likely will not be for another 2 to 3 years. Hence, the odds favor this being the best buying opportunity for some time. The next major opportunity will likely be at a higher price.”
The tweet makes a specific argument: violent corrections are normal inside secular gold bull markets, and the current correction may resemble an earlier-stage reset rather than a late-cycle top.
What the Chart Actually Shows
The chart plots gold from the late 1960s through August 2026 on a logarithmic scale. On a log chart, percentage moves become comparable across decades.
The yellow regions identify the two major secular advances: roughly 1970–1980 and 2001–2011. Within those advances, the smaller boxes highlight substantial corrections of around 20% or more. The current 2026 correction is boxed separately at the upper right.
 Source: X/@TheDailyGold
The historical analogy:
- 1970s bull: Breakout → huge advance → sharp 1973 correction → another advance → eventually a much deeper 1974–76 bear market → final explosive run into 1980.
- 2000s bull: Breakout → sustained advance → multiple corrections → violent 2008 selloff → recovery → acceleration → 2011 peak.
- Current bull: Breakout → acceleration → sharp ~20% correction → ?
That question mark is the entire investment thesis.
Read also: Gold & Silver Prices Just Got 4 Bullish Signals
The most important observation in the tweet is not that gold fell 20%. It is that gold has experienced corrections of this magnitude before without ending its secular bull market.
Jordan says the recent pullback was nearly identical to the 1973 correction and somewhat smaller—in both magnitude and duration—than the 2008 correction.
That comparison changes the interpretation of the decline. A trader looking only at the recent price action could see a sharp drop and conclude that gold’s major top has arrived. The historical chart offers another possibility: this could simply be the first serious reset within a much larger advance.
The 1975 Comparison Is Even More Interesting
The strongest claim in the tweet is:
“Gold is not yet at the comparable 1975 stage of a secular bull market and likely will not be for another 2 to 3 years.”
In the 1970s, gold did not simply rise uninterrupted into its 1980 blow-off top. After the enormous early advance, it suffered a prolonged and psychologically brutal decline around 1974–76. Only after that major mid-cycle reset did the final phase of the secular bull develop.
Jordan is arguing that today’s market hasn’t reached that point yet. His roadmap appears to be something like: current correction → renewed advance to substantially higher prices → eventually a much larger cyclical correction → final phase of the secular bull market.
What the Chart Does—and Doesn’t—Prove
There are only two previous secular gold bull markets shown here. That is an extremely small sample, and macroeconomic regimes differ enormously. The 1970s involved the collapse of Bretton Woods, oil shocks, and extreme inflation. The 2000s and 2010s involved a different combination of falling real rates, the financial crisis, quantitative easing, and dollar dynamics.
The defensible conclusion is not: “Gold followed this exact pattern twice, therefore it will do it again.” It is: “History shows that 20% corrections have occurred well before the ultimate peaks of previous secular gold bull markets. Therefore, a correction of this magnitude alone is weak evidence that the secular advance is finished.”
Another Bullish Feature Hiding in the Chart
After the 1980 peak, gold spent roughly two decades working through that excess before the next secular advance. After the 2011 peak, the correction and consolidation lasted roughly nine years before the decisive breakout above the old highs around 2020.
That long base matters. The current move is not emerging after a two-year speculative cycle. It follows more than a decade in which gold repeatedly struggled with the old 2011 high before eventually breaking decisively higher.
From a technical perspective, that gives you another argument: the larger the base, the more important the eventual breakout can be. And the chart suggests the present market may still be in the expansion phase following that breakout rather than the exhaustion phase.
Gold Price Prediction: Where to From Here?
The bullish case for the gold price prediction is that the recent correction was a normal reset within a secular bull market that still has years left to run. If that interpretation is right, gold could push toward $4,600–$4,700 by the end of 2026 and potentially challenge $5,000+ in 2027.
Major banks broadly agree with the long-term bullish outlook:
- UBS projects gold at $4,600 by end-2026 and $5,200 by mid-2027
- RBC expects an average of $4,732 in 2026, rising to $5,250 in 2027 and $5,500 in 2028
- HSBC sees a 2026 year-end price of $4,750 and a 2027 year-end price of $5,025
The key levels to watch:
LevelSignificance
$4,400Current resistance
$4,480–$4,500Next major hurdle
$4,700–$4,900Medium-term target
$5,000+Psychological barrier and 2027 target
The bearish scenario: If gold fails to hold above $4,300 and breaks back below $4,200, the breakout could be called into question. A move back toward $4,000 would not be surprising in that scenario.
Subscribe to our YouTube channel for daily crypto updates, market insights, and expert analysis.
The post Gold Price Prediction: This Chart Says We’re Not Even Close to the Top Yet appeared first on CaptainAltcoin.