Gold just broke above a trendline which stuck price for weeks. GOLD (XAU/USD) is trading at $4,385.24, up 0.79% today, recovering from its recent slide and pushing back toward the $4,400 mark
Gold just broke above a trendline which stuck price for weeks. GOLD (XAU/USD) is trading at $4,385.24, up 0.79% today, recovering from its recent slide and pushing back toward the $4,400 mark.
This Gold Price Prediction breaks down what's driving the move, the levels standing between here and a bigger rally, and whether the breakout has real follow-through.
Market data checked on September 18, 2026.
Quick Snapshot
Current trend: Bullish, As gold has broken the IMP Trendline
Main reason behind the move: Falling oil prices have eased inflation concerns and pushed bond yields lower.
What this article covers: The reasons behind today's move, the trendline breakout on the 4H chart, key support and resistance levels, bull and bear scenarios, and whether $4,679 is realistic.
Gold Price Prediction Today: Market Overview
Metric
Value
Price
$4,385.24
24h Change
+0.79%
Market Cap
$29.56T (+0.03%)
52-Week Range
$1.96K – $5.59K
Tokenized Gold Market Cap
$4.73B (+1.79%)
Tokenized Gold 24h Volume
$432.82M (-35.31%)
Why Is Gold Price Up Today?
Gold just broke above the descending trendline that had capped the price since late August, and reclaiming that kind of level on its own tends to pull in fresh buying as short-term traders react to the shift in structure.
On the macro side, the Bank of Japan raised its policy rate by 25 basis points to 1.25% on Friday, September 18, 2026, the highest level since 1995, but the decision was split 7-2, with two board members dissenting in favor of holding steady.
That split vote suggested a slower pace of hikes ahead than markets had feared, and the yen actually weakened instead of strengthening on the news, an unusual reaction for a rate hike.
Alongside that, Oil prices have been falling for a third straight session as Saudi Arabia works to restore flows through its East-West pipeline, which has eased inflation concerns and pulled bond yields lower.
That combination, a softer signal out of Japan plus cooling oil prices, is supporting gold alongside the trendline breakout on the chart.
Gold News: Key Events to Watch This Week
A busy economic calendar is ahead, and several events could move gold from here (all times US Eastern):
Sunday, Sep 20: China sets its 1-year and 5-year Loan Prime Rates, worth watching given China's role as a major, and partly unreported, gold buyer.
Wednesday, Sep 23: Flash PMI data lands across the US, UK, Germany, France, and the wider Eurozone, giving an early read on growth that can shift risk appetite and the dollar.
Thursday, Sep 24: The Swiss National Bank announces its policy rate, alongside US Unemployment Claims and New Home Sales, all events that can move bond yields and the dollar.
Friday, Sep 25: US Durable Goods Orders and the revised University of Michigan inflation expectations print are both closely watched for clues on where the Fed goes next.
On top of that, a long list of Federal Reserve officials are due to speak throughout the week, including Goolsbee, Williams, Jefferson, Barkin, Barr, Hammack, and Paulson.
With the Fed's rate path already in focus after this month's hike, any hints from these speeches about the pace of further moves could add volatility to gold in both directions.
Gold Technical Analysis
Gold had been sliding inside a descending trendline since late August, marking a series of lower highs. Around mid-September, the price tested that trendline, pulled back briefly, and broke the trendline but did not sustain above it, shifting the chart marks clearly with the recent reclaim. 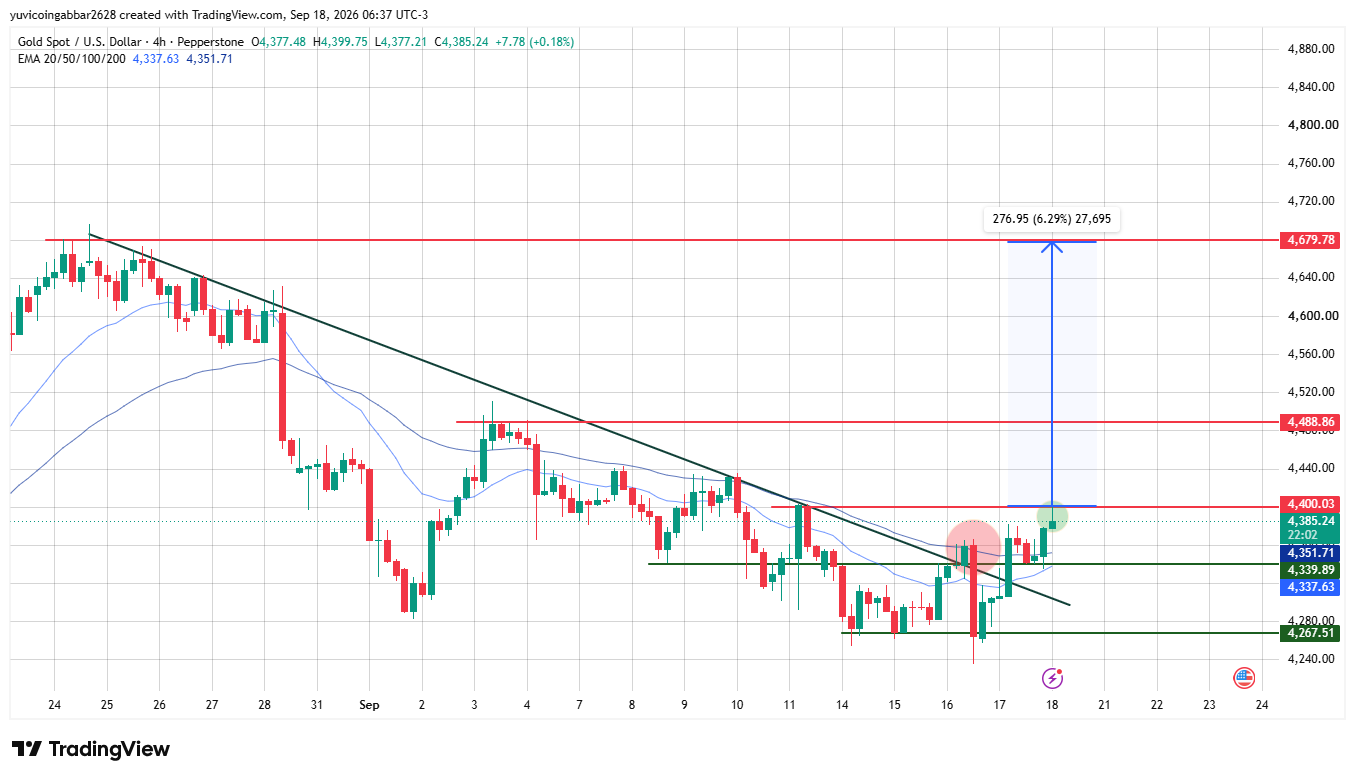
Gold is now consolidating just under the $4,400 zone at $4,385.24, on a candle that opened at $4,377.48, hit a high of $4,399.75, and had a low of $4,377.21.
The EMA cluster near $4,337.63 to $4,351.71 sits just below the current price and lines up closely with the broken trendline, making this zone the key support to hold.
If gold stays above it and clears the $4,400.03 resistance, the chart's measured-move projection points toward $4,679.78, a 6.29% move from the breakout zone.
Losing the EMA cluster again would put the trendline breakout in doubt, with $4,267.51 as the next support below it.
Gold IMP Support and Resistance Levels
Level Type
Price
Resistance 2
$4,679.78
Resistance 1 (nearest)
$4,488.86
Recent High / Reference
$4,400.03
Current Price
$4,385.24
Support (EMA + trendline)
$4,337.63 – $4,351.71
Deeper Support
$4,267.51
What Could Trigger or Invalidate the Gold Setup?
Scenario
Trigger
Likely Outcome
Invalidation
Breakout holds
Hold above $4,351, clear $4,488.86
Push toward $4,679.78
Close below $4,337.63
Range hold
Consolidate $4,337–$4400
Base before next move
Break below $4,267.51
Breakdown
Close below $4,337.63
Slide toward $4,267.51
Reclaim $4,351.71
Gold Price Prediction: Can Gold Reach $4,679?
It's the chart's own measured-move target if the trendline breakout holds, but gold would first need to clear $4,400, a level it hasn't tested yet since breaking the trendline. A rejection there would stall the move well before $4,679.78 comes into play.
Gold Price Prediction 2026: Expert Analysis
According to CoinGabbar analysts, The trendline breakout is the key technical development here, and it lines up with a genuine fundamental driver: falling oil prices easing inflation expectations.
The EMA cluster holding as support since the breakout is a good early sign, but $4,400 is the level that will show whether this move has real strength behind it.
Disclaimer
This article is for informational purposes only and isn't financial advice. Gold and commodity markets can move sharply on macro news. Always do your own research before making any trading decisions.
