After 6 months of brutal correction, gold seems to be bouncing back stronger. According to data, the yellow metal indeed finds a floor around $4,200 an ounce. Some analysts even already antic
After 6 months of brutal correction, gold seems to be bouncing back stronger. According to data, the yellow metal indeed finds a floor around $4,200 an ounce. Some analysts even already anticipate a rebound towards $4,400. For them, this is not just a simple technical move. It also comes with a sentiment reversal among institutions. According to the latest Bank of America survey, fund managers now consider the precious metal undervalued for the first time in over three years. A lasting trend or just an adjustment before the next cycle? Analysis.
In brief
- Fund managers consider gold undervalued for the first time since March 2023.
- The yellow metal rebounds 3.5% after defending the $3,900 to $4,000 support.
- Breaking through the $4,300-$4,400 level will determine the continuation of gold’s rebound.
The wind is turning in the gold market
Each month, Bank of America’s financial analysis division publishes the Global Fund Manager Survey. Closely followed by institutional investors, this survey is based on the responses of 180 to 210 managers representing nearly $500 billion in assets under management.
The June 2026 edition was conducted from June 5 to 11 with 198 panelists managing $540 billion in assets. It shows that the net percentage of managers considering gold as overvalued has fallen to its lowest level since February 2024.
In January, 45% judged it overvalued. A record since 2012! This reversal is however not trivial. It means that institutional investors, who had treated gold as a speculative bubble, now accept it as a reasonably valued asset. This perception is accompanied by a strong macro conviction: 58% of managers identified stagflation as their baseline 12-month scenario.
In mid-July, BofA publishes a new survey conducted from July 2 to 9. This time, it gathers the opinions of 210 managers administering $555 billion in assets. The verdict is quite different:
- growth expectations are at their highest since February 2026;
- inflation fears have dropped (only 4% net expect price increases vs 45% in June);
- equity allocations have risen.
Secure your cryptos with TrezorThis link uses an affiliate program.Two fundamental trends explain this apparent divergence
The first is the time lag. Indeed, June’s survey captured sentiment at the height of the correction, when gold flirted with $4,200. July’s survey highlights rising equity markets at the expense of defensive assets.
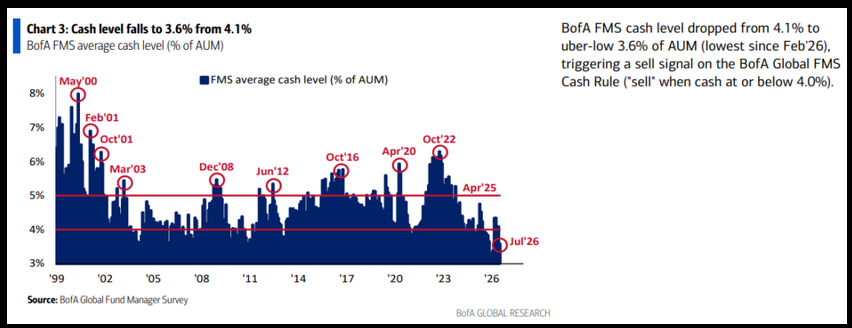
The second factor (and the most underestimated): the cash level of funds. It fell to 3.6% in July, its lowest since February 2026.
 (Source: Analizy)
In this context, Bank of America relies on a well-known empirical rule: when cash falls below 4%, it’s a sell signal for stocks. History since 2002 shows that such a signal is generally followed by a 1% stock drop over two weeks. Conversely, Treasuries gain the upper hand.
Analysis: gold does not rebound despite optimism, but because it has become excessive.
Gold rebounds despite the persistent appetite of institutional investors for equities
According to the survey results published by BofA, the average cash level held by managers drops from 4.1% to 3.6% of portfolios. According to Bank of America’s Cash Rule, any level below or equal to 4% triggers a contrarian sell signal on the markets.
The other survey results illustrate this offensive positioning:
- 82% of respondents consider long positions on semiconductor-related stocks the most crowded trade in the market;
- 45% identify a bubble in artificial intelligence as the main extreme risk;
- 83% expect no Fed rate hikes before the U.S. midterm elections scheduled for November.
Gold thus appears as one of the few assets still neglected by major investors. If an equity market correction materializes, part of the capital could redirect towards the precious metal.
However, Bank of America reminds that its survey was conducted from July 2 to 9, before several geopolitical developments. Notably, the failure of the ceasefire between the United States and Iran. This pushed oil above $90 a barrel and revived expectations of a more restrictive monetary policy.
The technical rebound of gold remains to be confirmed
The sentiment shift is accompanied by a first encouraging signal on the chart. In two sessions, gold indeed rises about 3.5% after defending the support zone between $3,900 and $4,000. In the last session analyzed, the metal gained another 1.74% to close at $4,148. This is its highest level since July 7.
This zone corresponds to the 50% Fibonacci retracement, located at $3,943. Technical analysts often call this the golden ratio. Indicators also show a gradual momentum improvement. For example, the relative strength index (RSI) climbs to 52. It thus returns to a neutral zone after several weeks of weakness.
Upstream, the gold price still trades below the downward trendline drawn from the historic peak of $5,598. The first major resistance is between $4,300 and $4,400, with a Fibonacci level at $4,334. This corresponds to about 4% to 6% above current prices.
A rejection below this resistance could bring the metal back to the $3,552 zone. This corresponds to the 61.8% Fibonacci retracement, or a potential decline of about 14%.
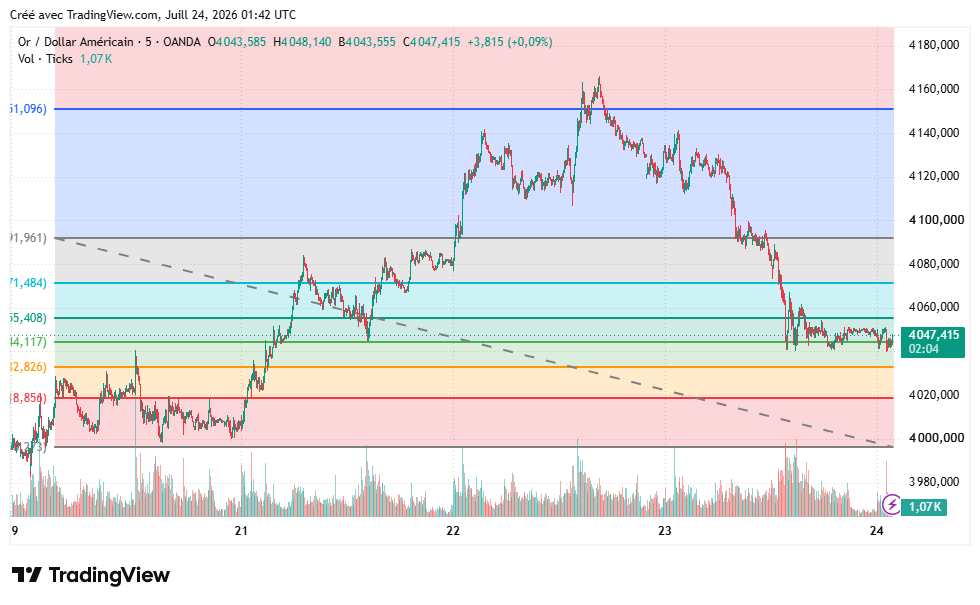 Chart showing gold price evolution over a 5-day period
In any case, the managers have decided: gold has not been this cheap in three years. It remains to be seen if the market will follow! The Fed’s decision and the outcome of the Iran-U.S. truce will likely provide an initial response as early as next week. Story to follow…