Inflation Data Drives the Rebound Gold reclaimed the $4,000-per-ounce level on June 25, 2026, as softer U.S. inflation readings and a pullback in oil prices weighed on Treasury yields and the
Inflation Data Drives the Rebound
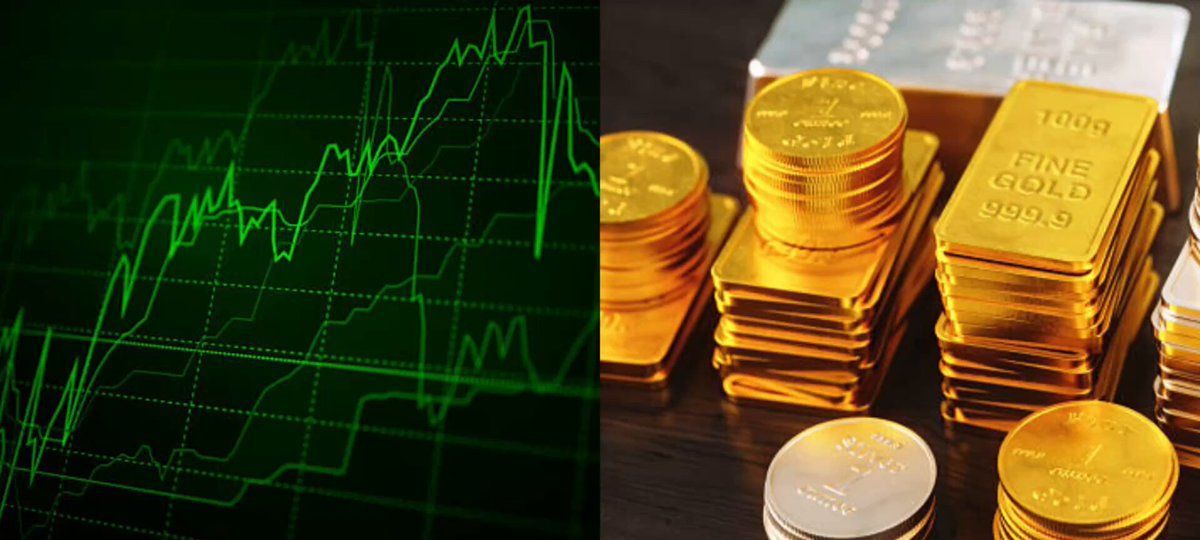
Gold reclaimed the $4,000-per-ounce level on June 25, 2026, as softer U.S. inflation readings and a pullback in oil prices weighed on Treasury yields and the U.S. dollar. The move gave the precious metal a brief reprieve after weeks of selling pressure driven by a hawkish Federal Reserve stance.
The catalyst was an inflation report that met consensus expectations, giving traders enough cover to trim aggressive bets on further Fed rate increases. Gold serves as a debasement hedge against the erosion of a currency's purchasing power, but because it carries no real yield, it tends to underperform when Treasury and money-market yields are expected to rise. A reading that did not exceed forecasts was therefore enough to loosen that headwind, at least temporarily.
The U.S. May PCE price index, the Fed's preferred inflation gauge, was scheduled for release on June 25. April's core PCE had come in at 3.3% year-on-year, and a reading at or below that level was seen as key to relieving downward pressure on gold.
Context: A Market Under Pressure
Gold broke above $5,000 for the first time on January 26, 2026, driven by safe-haven demand, geopolitical tensions, dollar weakness, and heavy central bank buying. The metal reached an all-time high of $5,595.75 on January 29, 2026, roughly 113% above its level two years earlier. The subsequent retreat has been steep.
In June, the price dropped to the $4,023 to $4,548 range amid easing geopolitical tensions following reports of a U.S.-Iran peace agreement. Weakening demand for safe-haven assets added to the downward momentum, though the metal has continued to trade above the $4,000 support level.
Despite Wednesday's intraday bounce, gold remains approximately 5% lower year-to-date when measured from its early 2026 peak range. Chair Warsh's prioritization of price stability and Fed Governor Waller's opposition to rate cuts pushed market-implied probabilities for a July hike to 36%, while a strengthening U.S. Dollar Index above 101 and rising Treasury yields continued to weigh on the metal.
Goldman Sachs lowered its year-end 2026 gold price target from $5,400 to $4,900 per troy ounce in June, citing expectations that the Federal Reserve will not cut rates this year. The bank noted that this rate policy will exert sustained short-term pressure on the gold price. Whether cooler inflation prints can shift that calculus remains the central question for gold traders heading into the second half of the year.
Sources:J.P. Morgan Global Research: Gold Price Predictions for 2026 and 2027TradingKey: Gold Price Risks Falling Below $4,000, PCE Data Is KeyCapital.com: Gold Price Forecast, June 2026