What to Know GRAM trades at $1.6667, up 3.10%, with its latest daily candle rising above the upper Bollinger Band at $1.5854. RSI has reached 73.74, showing strong buying momentum while placi
What to Know
- GRAM trades at $1.6667, up 3.10%, with its latest daily candle rising above the upper Bollinger Band at $1.5854.
- RSI has reached 73.74, showing strong buying momentum while placing GRAM above the conventional overbought threshold of 70.
- Holding above $1.5854 could support another move toward $1.7236, while a retreat below that band would test breakout strength.
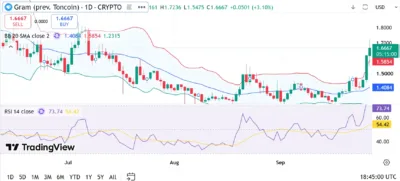
Gram (GRAM), labeled “Gram (prev. Toncoin)” on TradingView chart, trades at $1.6667, up 3.10% on the displayed daily candle. The price has climbed above the upper Bollinger Band at $1.5854 and reached $1.7236 during the session, although the candle remains open in the screenshot.
The 14-day Relative Strength Index (RSI) stands at 73.74, above both its moving average of 54.42 and the conventional overbought threshold of 70. Buyers have gained momentum, but the elevated reading also raises the possibility of a pullback if the breakout loses support.
Also Read: Utya (UTYA) Price Prediction 2026–2030: Can UTYA Hit $0.10 Soon?
GRAM Breaks Above Its Recent Range
The chart shows GRAM recovering from a stretch of trading largely between $1.30 and $1.50 before advancing through the upper end of that range. Its move to $1.7236 places the recent high near the next level buyers must reclaim to extend the rally.
A sustained rise beyond $1.7236 could bring $1.80 into view, followed by the headline target of $2. However, GRAM’s retreat from the session high to $1.6667 shows that buyers have yet to hold the full advance.
Bollinger Bands Mark Key Support
The upper Bollinger Band sits at $1.5854, making it an immediate level to watch if GRAM pulls back. The middle band stands at $1.4084, while the lower band is at $1.2315.
Holding above $1.5854 would help preserve the breakout and support another attempt at $1.7236. A daily close back below the upper band could point to weaker momentum, with $1.4084 becoming the next indicator level to monitor.
RSI Signals Strong Momentum
GRAM’s RSI reading of 73.74 confirms that the recent advance has been forceful, although readings above 70 can accompany both sustained rallies and abrupt reversals. The indicator’s position above its 54.42 moving average shows that buying momentum remains stronger than its recent baseline.
If RSI stays elevated while price clears $1.7236, the case for a move toward $1.80 would strengthen. Conversely, falling RSI alongside a price move below $1.5854 would suggest that the breakout is losing strength.
Source: TradingView
Gram (GRAM) Price Prediction 2026–2030
Year
Minimum
Average
Maximum
2026
$1.20
$1.65
$2.00
2027
$1.10
$1.80
$2.50
2028
$1.25
$2.10
$3.20
2029
$1.40
$2.50
$4.00
2030
$1.50
$3.00
$5.00
Price Forecast by Year
2026
GRAM could test $2 if buyers sustain the breakout above $1.5854, clear the session high of $1.7236, and maintain demand through the $1.80 area. A reversal below the middle Bollinger Band at $1.4084 would instead make the lower end of the projected range more plausible.
2027
If GRAM establishes support above its current trading range, further gains could bring the illustrative $2.50 maximum into consideration. Weaker participation or repeated failures to hold breakouts could keep the token closer to the projected $1.10 minimum.
2028
A sustained series of higher price ranges could support the $3.20 bullish scenario, while the table’s $2.10 average reflects a more moderate path. The daily chart alone cannot establish whether demand will remain strong enough to support either outcome.
2029
Continued growth could place $4 within reach under favorable market conditions, although reaching that level would require a much larger advance than the current breakout. If momentum fades, GRAM could instead trade closer to the illustrative $1.40 minimum.
2030
The $5 maximum represents a highly bullish scenario requiring a substantial increase from the displayed price of $1.6667. The $3 average offers a less aggressive illustration, but longer-term prices remain uncertain and depend on factors beyond the supplied chart.
Conclusion
GRAM trades above its upper Bollinger Band, and its RSI shows strong buying momentum, although the open daily candle has already retreated from its $1.7236 high. Holding above $1.5854 could support another attempt at that high, while a move below the band would put the breakout under pressure. The $2 target is within reach of the current price, but GRAM must first clear $1.7236 and sustain further gains; the chart cannot establish when or whether that will happen.
FAQs
1. Is GRAM bullish on the supplied chart? GRAM trades above its upper Bollinger Band and has an RSI of 73.74, although the elevated RSI also signals increased pullback risk.
2. What is GRAM’s immediate resistance? The session high of $1.7236 is the nearest visible level to reclaim, followed by the $1.80 area.
3. What support level matters most for GRAM? The upper Bollinger Band at $1.5854 is the immediate level to watch, followed by the middle band at $1.4084.
4. Is GRAM’s RSI overbought? Yes. Its displayed RSI of 73.74 is above the conventional overbought threshold of 70.
5. Can GRAM reach $2? GRAM could reach $2 if it moves beyond $1.7236 and sustains its advance, but the supplied chart does not make that outcome certain.
Also Read: Phala Network Price Prediction 2026–2030: Can PHA Hit $0.10 Soon?
The post Gram (GRAM) Price Prediction 2026–2030: Can GRAM Hit $2 Soon? appeared first on 36Crypto.