GRVT is the native token of a decentralized derivatives exchange built for on-chain perpetual trading with centralized-exchange-like speed. The token is used for trading incentives, fee mecha
GRVT is the native token of a decentralized derivatives exchange built for on-chain perpetual trading with centralized-exchange-like speed.
The token is used for trading incentives, fee mechanics, and participation in the platform's ecosystem programs.
This GRVT Token Price Prediction looks at whether the recent breakout from a tight consolidation range can extend further, based on current chart structure, liquidation activity, and exchange volume data.
Here's what the numbers show.
Market data checked on August 5, 2026, at 14:15 IST.
GRVT Token Price Prediction Today: Market Overview
Metric
Value
Price
$0.3499
24h Change
+20%
Market Cap
$37.328M
FDV
$326.547M
24h Volume
$186.042M
TVL
$36.701M
Circulating Supply
114.312M GRVT
Total Supply
1B $GRVT
Max Supply
1B $GRVT
Source: Data from CoinGecko as of August 5, 2026, 09:31 at 14:15 IST. Figures may vary slightly across other tracking websites.
GRVT Liquidation and Volume Data
Futures liquidation and exchange volume figures below are sourced from Coinglass and are kept separate from the spot volume referenced above.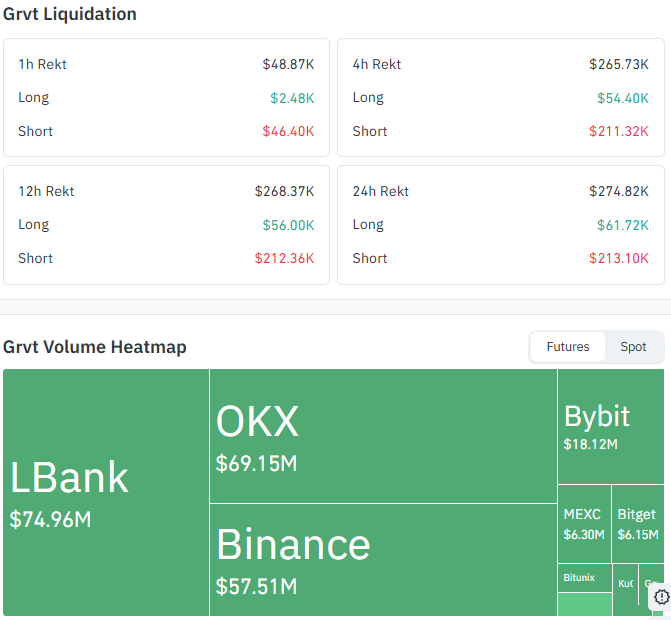
Source: Data From CoinGlass
Window
Total Rekt
Long
Short
1h
$48.87K
$2.48K
$46.40K
4h
$265.73K
$54.40K
$211.32K
12h
$268.37K
$56.00K
$212.36K
24h
$274.82K
$61.72K
$213.10K
Short liquidations dominate every window shown, and the gap is especially wide in the 1h window, indicating shorts have been consistently squeezed as GRVT pushed through its recent breakout.
Futures Exchange Volume
Exchange
Volume
LBank
$74.96M
OKX
$69.15M
Binance
$57.51M
Volume is fairly spread across LBank, OKX, and Binance, with no single exchange dominating the way seen on some other tokens, pointing to broad participation in the breakout move.
$GRVT Price Prediction Chart: Technical Analysis
Pair: $GRVT/USDT · Market: Spot (Crypto) · Exchange: KuCoin · Timeframe: 4H · Source: TradingView · Timestamp: August 5, 2026, 14:15 UTC+5:30
GRVT is trading at $0.3499, after breaking out of a tight consolidation range and treandlie range. The breakout candle was sharp and decisive, pushing the price well above the prior range in a single 4H move.
The EMA 20 (Exponential Moving Average, a momentum indicator that weights recent candles more heavily, kept separate from the horizontal levels below) sits at $0.2783, well below current price and now acts as a distant support rather than a near-term factor.
RSI (14) has climbed to 76.47, firmly in overbought territory, which raises the chance of a short-term pullback or consolidation even if the broader breakout structure stays intact.
A far Fibonacci 1.618 extension sits at $0.6814, well above current price, marking a longer-term level rather than an immediate one.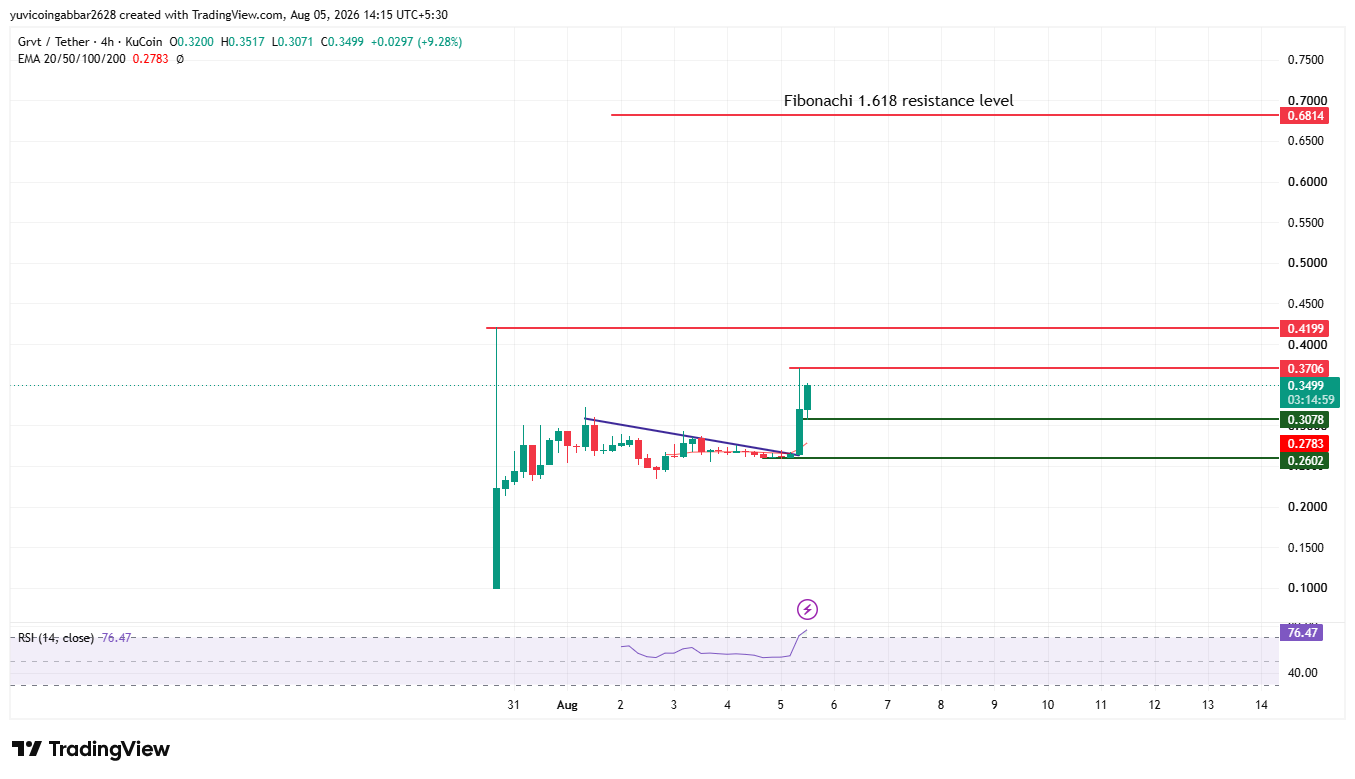
Support and Resistance Levels
Level Type
Price
Resistance 3 (fib 1.618 extension)
$0.6814
Resistance 2
$0.4199
Resistance 1 (nearest)
$0.3706
Immediate Price Reference
$0.3499
First Support (breakout retest zone)
$0.3078
Deeper Support (EMA 20)
$0.2783
Structural Floor
$0.2602
EMA Levels
EMA
Price
EMA 20
$0.2783
$GRVT Forecast: Bull Case vs. Bear Case
$GRVT price target 2026 Bull case: Holding above the first confirmed support at $0.3078, the breakout retest zone, keeps the structure intact even with RSI overbought.
A confirmed move above the nearest resistance at $0.3706 would open the path toward $0.4199, with the far fib extension at $0.6814 as a longer-term level if momentum extends.
$GRVT price target 2026 Bear case: A pullback that breaks below the first confirmed support at $0.3078 would suggest the breakout is fading, especially given the overbought RSI reading.
Losing the EMA 20 near $0.2783 would expose the structural floor at $0.2602, putting the entire $breakout back in question.
$GRVT price target: Can $GRVT Reach $0.6814?
$0.6814 is the highest resistance level marked on the chart, a Fibonacci 1.618 extension well above the current price.
Reaching it would require $GRVT to first clear the nearest resistance at $0.3706 and then $0.4199, a multi-stage move that would need sustained momentum well beyond the current overbought RSI reading rather than a single $breakout leg.
What Could Invalidate the Bullish Setup?
A rejection near the nearest resistance at $0.3706 followed by a close back below the first confirmed support at $0.3078 would put the breakout in question, particularly given RSI is already overbought.
A deeper break below the EMA 20 at $0.2783 and the structural floor at $0.2602 would undermine the $breakout structure entirely.
GRVT Token Price Prediction 2026: Expert View
According to CoinGabbar analysts, The liquidation data shows a consistent short squeeze pattern across every window, with shorts losing far more than longs at the 1h, 4h, 12h, and 24h marks, indicating short positions have been under sustained pressure as GRVT broke out.
Futures volume is fairly distributed across LBank, OKX, and Binance rather than concentrated on one venue, suggesting the move has drawn participation from multiple corners of the market.
The overbought RSI reading at 76.47 is the key caution flag right now: it does not invalidate the breakout, but it does raise the odds of a cooldown before any further push toward $0.3706 and beyond.
GRVT Token Price Prediction: Data Sources
Price and EMA data referenced from a 4H $GRVT/USDT chart via TradingView on KuCoin, timestamped August 5, 2026, 14:15 UTC+5:30.
Market cap, FDV, volume, and supply data referenced from Coingecko. Liquidation and exchange volume data referenced from Coinglass.
Disclaimer: This piece is for informational purposes only and isn't financial advice. The levels and scenarios above are based on technical chart analysis and publicly available data at the time of writing, and crypto markets can move sharply within hours, so past patterns don't guarantee future outcomes. It's worth doing independent research and considering your own risk tolerance before acting on any of the levels discussed here.