Hedera price prediction searches are climbing again, and $HBAR has just done something traders were waiting on for days. A fresh headline about the network is also doing the rounds. The chart
Hedera price prediction searches are climbing again, and $HBAR has just done something traders were waiting on for days.
A fresh headline about the network is also doing the rounds. The chart now has two big levels that decide the next move, and both are laid out below.
The editorial desk holds no personal position in HBAR. This is purely a chart and data read.
Quick answer: HBAR trades at $0.10384. A 1-hour close above $0.10717 opens $0.13094 and then $0.15005. A 1-hour close below $0.09193 points to $0.08815.
HBAR Price Today: Live Market Data and Open Interest Snapshot
HBAR's current market price (CMP) is $0.10384. Market cap stands at $4.58B. Futures volume over 24 hours is $147.59M against spot volume of $33.57M.
Open interest, the total value of futures contracts still open, is $235.97M. Circulating supply is 43.99B HBAR out of a 50.00B maximum.
Source: CoinGlass, Oct 5, 2026, 9:42 AM.
Hedera Stablecoin Supply Surge: Latest News and Price Impact
An unverified report from BSCN on X says Hedera's native stablecoin market cap jumped 71% in the past week to around $48M.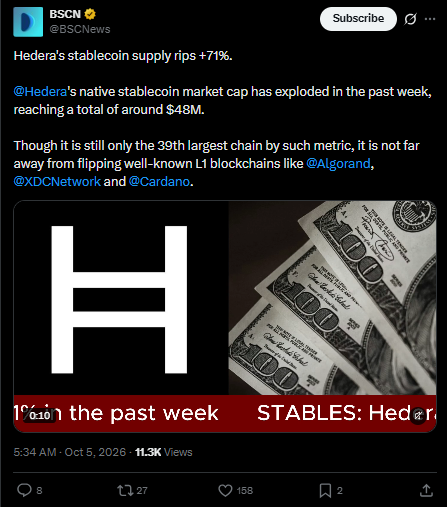
By that measure the network ranks 39th among blockchains. The post adds that it sits not far from flipping Algorand, XDC Network, and Cardano.
The figure is small next to HBAR's $4.58B market cap. Still, rising stablecoin supply points to more on-chain activity, which supports the network story behind the price.
Source: BSCN on X, Oct 5, 2026, 5:34 AM.
Key Takeaways: HBAR Forecast and Breakout Levels at a Glance
CMP is $0.10384 on the 1-hour Binance chart.
Price has pushed through its descending trendline.
A 1-hour close above $0.10717 targets $0.13094, then $0.15005.
A 1-hour close below $0.09193 targets $0.08815.
RSI divergence reads 59.02.
HBAR Technical Analysis: Trendline Breakout on the 1-Hour Chart
Methodology: HBAR/USDT, 1-hour timeframe, Binance, with RSI divergence as the indicator. 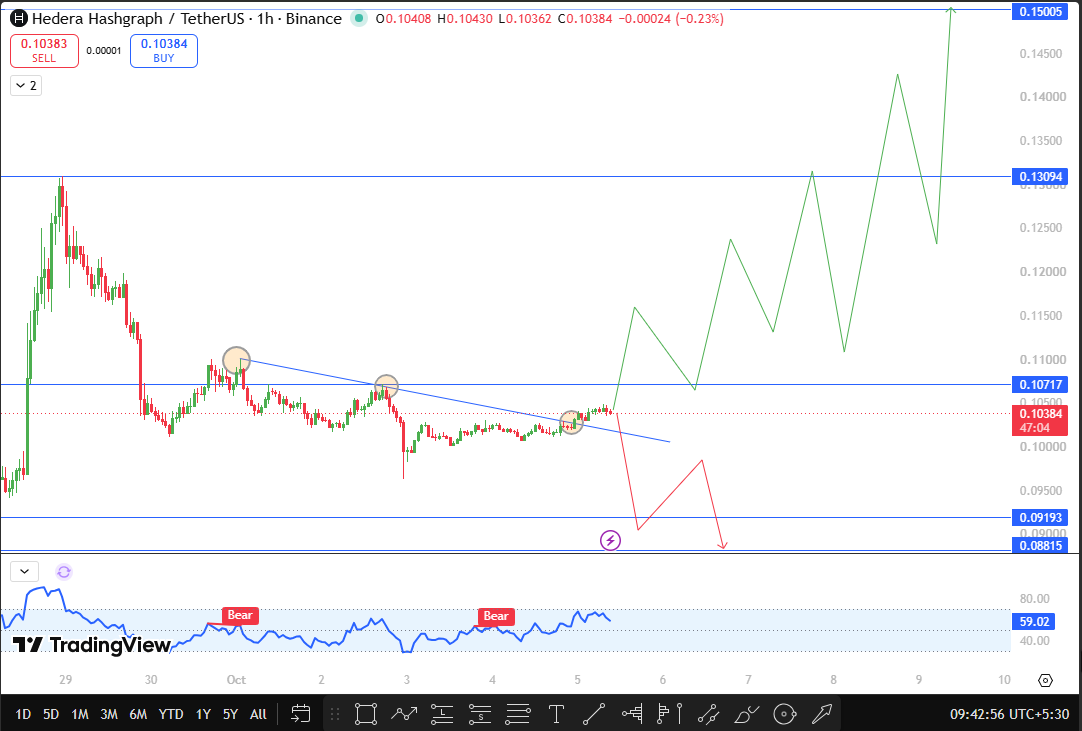
The bullish case is invalid on a 1-hour close below $0.09193.
For days, the price stayed capped under a descending trendline. The first two touches ended in rejection and pushed the price lower.
On the third touch, buyers got through, and the price now trades above the line at $0.10384. That shows sellers losing control, but one breakout candle is not confirmation.
RSI divergence reads 59.02. Earlier bearish readings appeared on Sep 30 and Oct 3, and the current reading sits well above both. The real test is $0.10717, the level that held price down on the previous bounce.
Support and Resistance Levels: Key HBAR Price Targets to Track
Level
Type
Importance
Distance From CMP
$0.15005
Resistance
Final upside target
+44.50%
$0.13094
Resistance
Second upside target
+26.10%
$0.10717
Resistance
Breakout trigger
+3.21%
$0.10384
CMP
Current price
0%
$0.09193
Support
Breakdown trigger
-11.47%
$0.08815
Support
Final downside target
-15.11%
Bullish and Bearish Price Outlook: Breakout Scenarios Explained
Bullish Scenario: Close Above $0.10717 Opens $0.13094
Confirmation needs a 1-hour close above $0.10717. Targets are $0.13094 first and $0.15005 next.
The move is stronger if price holds the broken trendline on any pullback. It weakens if the price slips back under $0.10717 and stays there.
Base Scenario: Range Between $0.09193 and $0.10717
If neither level breaks on a 1H close, the price stays in this band. Expect chop while the trendline retest plays out.
Bearish Scenario: Close Below $0.09193 Targets $0.08815
A 1H close below $0.09193 puts $0.08815 in play. This also invalidates the bullish read.
The sell-off is stronger if the price fails to reclaim the trendline first. It weakens if buyers defend $0.09193 quickly.
Market Context: Liquidity, Open Interest, and Trader Positioning
Futures volume is roughly four times spot volume, so leveraged traders drive most of the action.
With open interest at $235.97M, a decisive close at either level can trigger fast moves as positions get squeezed.
Risks to the HBAR Price Forecast and Breakout Invalidation Rules
A breakout on the 1-hour timeframe can reverse quickly. The stablecoin report is unverified, and the supply involved is small next to HBAR's market cap.
Heavy derivatives activity can also create sharp wicks. Stick to closes, not intraday spikes.
Conclusion: What the HBAR Breakout Means for Price Prediction
HBAR has cleared its descending trendline and now trades at $0.10384. The decision zone is $0.10717 above and $0.09193 below.
A close above the first opens $0.13094 and $0.15005. A close below the second brings $0.08815 into view.
Disclaimer: Educational Chart Analysis, Not Financial Advice
This article is for educational purposes only and is not financial advice. Crypto markets are volatile. Do your own research before making any trading decision.