Hedera is quietly building a case for itself as core infrastructure for the digital economy, and the chart underneath HBAR right now backs that narrative with a setup worth watching closely.
Hedera is quietly building a case for itself as core infrastructure for the digital economy, and the chart underneath HBAR right now backs that narrative with a setup worth watching closely.
A key trendline is once again being tested, and how price behaves here could shape the next major move for this Hedera price prediction.
Layer in a fresh explainer on Hedera's growing role in verifiable data, and the picture gets even more interesting. Here is the full breakdown.
Hedera Price Today: Live HBAR Data and 24-Hour Change
HBAR is trading around $0.07986 on the 4-hour chart, holding largely flat with a small loss of $0.000007982, down 0.01% over the past 24 hours per CoinGlass data.
Hedera futures volume over the last day stands at $86.23 million, while spot volume adds another $23.19 million, showing steady participation behind this Hedera price prediction discussion.
The Hedera market cap currently sits near $3.49 billion, with open interest at $115.69 million, reflecting a meaningful but not overheated amount of leveraged positioning right now.
Circulating supply stands at 43.83 billion HBAR, close to the total and max supply of 50.00 billion, meaning most of Hedera's eventual token supply is already active in the market. Source: CoinGlass, Hedera data, Sep 9, 2026
Hedera News: HCS Positioned as a Trust Layer for the Digital Economy
The standout piece of Hedera latest news comes from a post by AllInCrypto on X, published September 9, 2026, at 12:30 AM, explaining why the Hedera Consensus Service, known as HCS, could become a critical trust layer for the digital economy. The post argues HCS is not trying to replace databases but instead creates a tamper-resistant, independently verifiable record of exactly what happened, when, and in what order, pointing to use cases across AI outputs, payments, supply chains, financial markets, and digital identity.
It also breaks down the guarantees HCS offers, including fair message ordering, timestamped consensus, an append-only log, and independent verification, while being clear that HCS is not a database itself since it does not maintain application state or offer built-in querying.
This kind of grounded, technical explainer adds real depth to the current Hedera trend analysis, framing HBAR's utility around trusted data infrastructure rather than short-term hype.
The post had already crossed 6,000 views within hours of going live. Source: AllInCrypto (@RealAllInCrypto) on X, Sep 9, 2026, 12:30 AM
HBAR Quick Take: Key Trigger and Support Levels Today
CMP: $0.07986 (4H chart, Binance)
Resistance trigger: break and close above $0.08684 needed to confirm the breakout
Support trigger: break and close below $0.07288 needed to open further downside
Data timestamp: Sep 9, 2026
Risk note: price is trading in a fairly tight range right now, so a confirmed close on either side could move faster than the recent daily range suggests
Hedera Technical Analysis: HBAR Price Forecast and Trend Outlook
Looking at the 4-hour HBAR chart on Binance, the price has been climbing steadily by taking repeated support from a well-defined ascending trendline, and it is currently sitting right at another retest of that same trendline.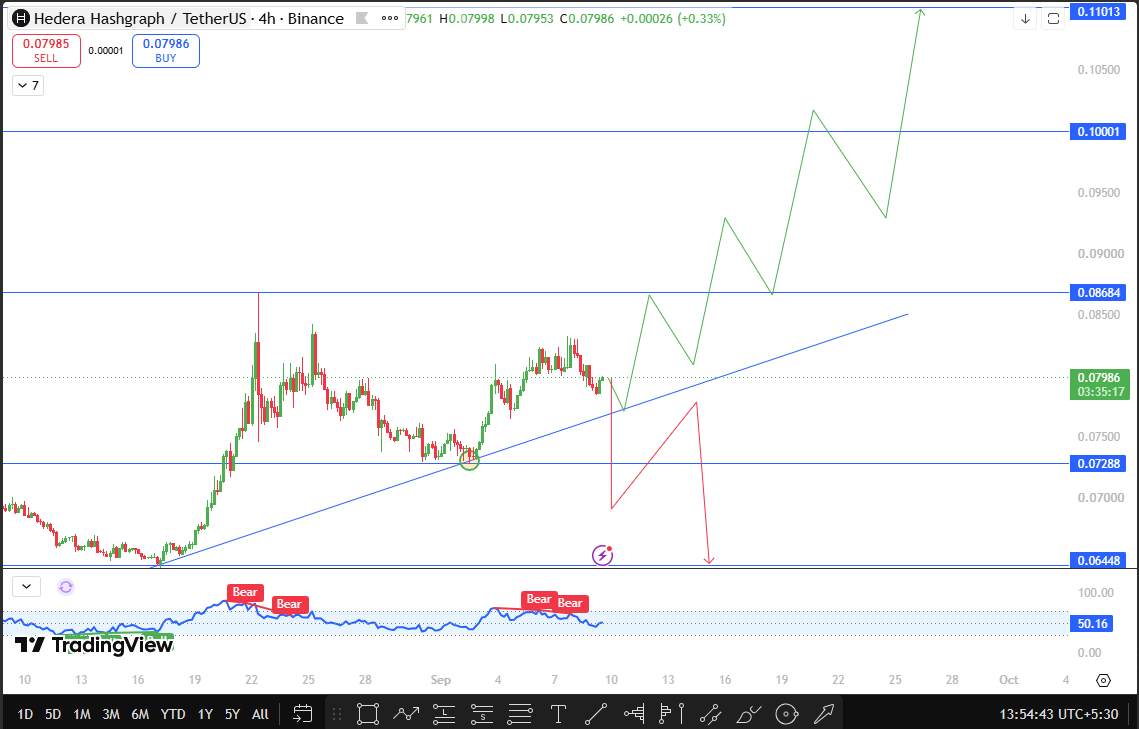
Each prior touch of this trendline has acted as a springboard for the next leg higher, which is exactly the kind of repeated respect for a level that gives a Hedera price prediction like this one real technical weight.
Right now HBAR is holding just above the trendline rather than slipping through it, and that matters.
If the trendline continues to hold here the way it has on previous tests, the setup favors another push toward the upside rather than a breakdown.
The key level to watch for that continuation is $0.08684.
A 4-hour close above this level would confirm the breakout is underway, opening the door toward $0.10001 and then $0.11013 next, a level that sits close to 25.2% above the current price and lines up with the psychological 0.10 mark, always a level that tends to draw extra attention once the price gets close to it.
On the other hand, if the trendline finally gives way and HBAR closes below $0.07288, that would be a clear signal the current uptrend structure is breaking down rather than just pausing.
A close there marks roughly an 8.7% drop from current levels. In that scenario, the next support for this HBAR price forecast comes in at $0.06448, about 19.3% below CMP.
Given how consistently the trendline has held up until now, sellers would need real conviction to force a close below that support zone, so this level is worth tracking closely if selling pressure starts to build.
For now, the trendline retest remains the single most important thing on this chart, and how price closes around it over the next few candles should go a long way toward deciding which of these two paths plays out. Source: TradingView, HBAR/USDT, Binance, 4H chart, Sep 9, 2026
HBAR Support and Resistance Levels to Watch
Level Type
Major Resistance
Price
$0.11013
Change from CMP ($0.07986)
+37.90%
Resistance
$0.10001
+25.2%
Breakout Confirmation
$0.08684
+8.7%
Current Market Price
$0.07986
—
Breakdown Trigger
$0.07288
-8.7%
Support
$0.06448
-19.3%
HBAR Price Prediction Scenarios: Bull, Base, and Bear Cases
In the bull case, the ascending trendline holds one more time just as it has on every prior retest, and HBAR pushes through to close above $0.08684.
That would confirm the breakout and put $0.10001 firmly in play, with the growing narrative around HCS as trusted digital infrastructure giving longer-term holders extra reason to stay patient through the move.
The base case has HBAR continuing to consolidate between $0.07288 and $0.08684 for a while longer, testing the trendline without a decisive close in either direction.
Given how tight the recent range has been, this kind of sideways action would not be unusual, and it often sets up a sharper move once one side finally gives way.
The bear case plays out if the trendline finally fails after holding through multiple prior tests, with HBAR closing below $0.07288.
That would mark a real shift in structure rather than a routine pullback, shifting focus down to $0.06448 as the next support level for this Hedera price outlook.
Risks to This Hedera Price Outlook
A trendline that has held through several retests can still eventually break, and repeated past success is never a guarantee of future support.
Broader crypto market direction, Bitcoin's own price behavior, and shifts in overall risk sentiment can all override a coin-specific setup like this one.
With open interest at $115.69 million, a confirmed close on either side of this range could still trigger a faster reaction than the recent price action suggests.
This article is for informational purposes only and should not be treated as financial advice.
Key Terms for Hedera Price Prediction
Ascending Trendline: A rising line connecting a series of higher lows, marking where buyers have repeatedly stepped in during an uptrend.
Trendline Retest: A move where price returns to touch a previously established trendline again, often used to gauge whether that level still holds.
Breakout Confirmation: A decisive close beyond a key resistance level that validates a genuine continuation of the existing trend.
Open Interest: The total value of outstanding derivative contracts on an asset, used to gauge how much leveraged positioning is active in the market.
Support and Resistance: Price zones where historical buying or selling pressure has been strong enough to pause or reverse a move.
Disclaimer
This article is intended for informational and educational purposes only. It does not constitute financial, investment, or trading advice. Cryptocurrency markets are highly volatile, and readers should conduct their own research or consult a qualified financial advisor before making any investment decisions.