Hedera price prediction is the talk of the market today, and HBAR is sitting at a spot that traders cannot ignore. A fresh ETF inflow report, an active futures market, and a price that refuse
Hedera price prediction is the talk of the market today, and HBAR is sitting at a spot that traders cannot ignore.
A fresh ETF inflow report, an active futures market, and a price that refuses to pick a side have all arrived at once. Is a big move about to begin, or is a shakeout coming first? Here is the full read.
Editorial note: our desk holds no personal position in HBAR; this is purely a chart and data read.
Live Market Cap, Trading Volume, and Open Interest Snapshot Today
Hedera's price today stands at 0.10079, the current market price (CMP) on the Binance 1H chart (Oct 3, 2026, around 12:49 PM IST).
Market capitalization is $4.43B, open interest (the total value of open futures contracts) is $229.36M, 24h futures trading volume is $297.36M, and spot volume is $76.15M. Circulating supply is 43.99B against a total and max supply of 50.00B.
Source: CoinGlass and TradingView, Oct 3, 2026, 12:49 PM IST
Reported Spot ETF Inflows: Canary Fund Sees Best Day Since May
Hedera's latest news centers on a BSCN (@BSCNews) X post published about 6 hours earlier. 
It says Canary's spot Hedera ETF recorded $2.1M in net inflows on the first day of October, the most in a single day since May 6. It adds that inflows have been muted overall, and the fund has logged just one day of net outflows so far.
This is an unverified report from a news outlet, not an official announcement. For anyone tracking HBAR news today, it is a demand signal to watch and not a price trigger, because Hedera news of this kind can fade fast if inflows stay light.
Source: BSCN (@BSCNews) on X, about 6 hours before Oct 3, 2026, 12:49 PM IST
Key Takeaways: Breakout Triggers, Price Targets and Support Levels
CMP is 0.10079 on the 1H chart, inside a descending channel.
A 1-hour close above 0.10988 opens 0.13112, then 0.15021.
A 1-hour close below 0.09175 opens 0.08831.
Open interest is about 5.2% of market capitalization.
The ETF inflow report is unverified.
Hedera Technical Anlaysis: Breakout or Breakdown
Methodology: 1H Binance chart, descending channel, and marked support and resistance levels. Invalidation: a 1-hour close below 0.09175.
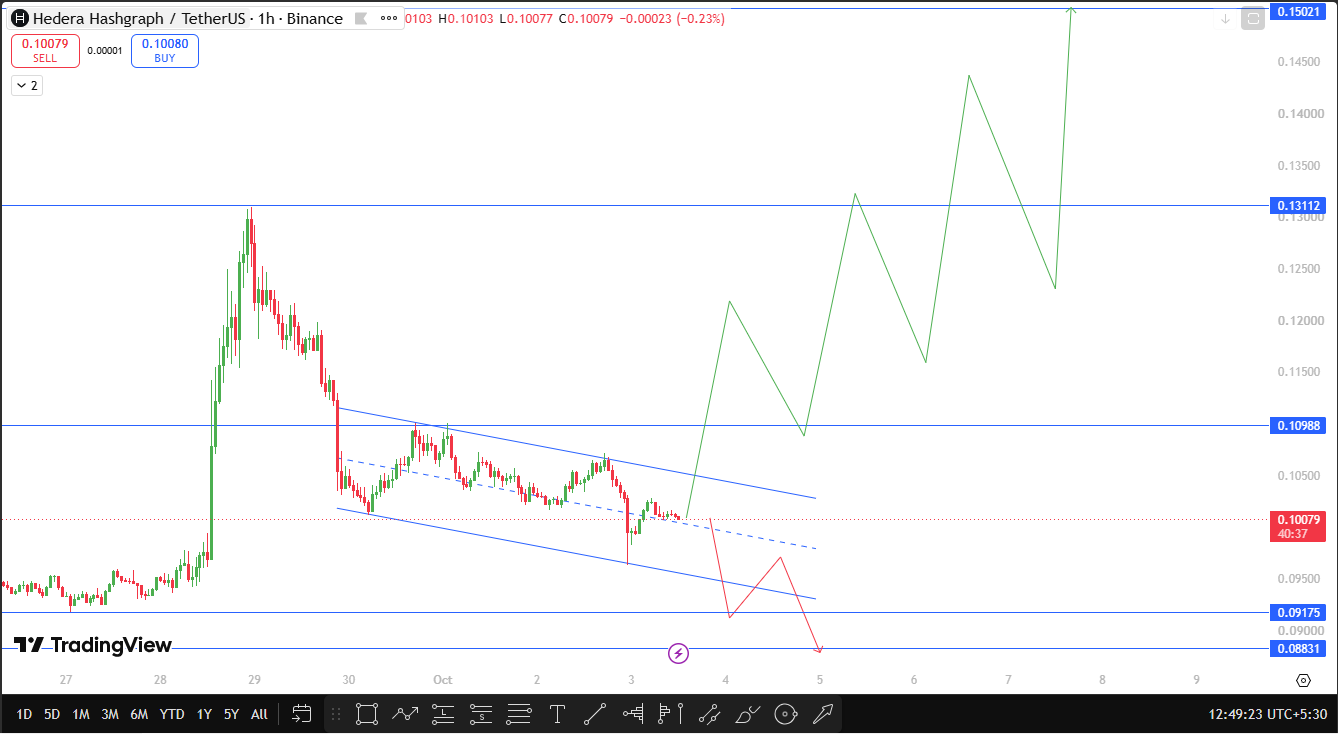
This Hedera technical analysis starts with the sharp spike to the Sep 29 high near 0.13112, followed by a steady bearish trend that carved out a descending channel. At 0.10079, price action sits near the channel midline, well inside its boundaries, so neither side has taken control.
A 1h close above 0.10988 would push the price out of that falling structure and into the next resistance zone. In this HBAR technical analysis, the 0.09175 support zone is the level that protects the downside, and a 1h close under it opens 0.08831.
HBAR Support and Resistance Levels: Major Breakout Price Zones
Level
Type
Importance
Distance From CMP
0.15021
Resistance
Final upside target
+49.03%
0.13112
Resistance, Sep 29 high
Second target
+30.09%
0.10988
Resistance, breakout trigger
Key confirmation level
+9.02%
0.10079
CMP
Reference price
0.00%
0.09175
Support
Invalidation level
-8.97%
0.08831
Support
Next downside target
-12.38%
Price Outlook: Bullish, Base, and Bearish Scenarios Explained
Bullish Scenario
Confirmation is a 1-hour close above 0.10988. The HBAR price target path is 0.13112 first, then 0.15021. It gets stronger if the price holds above 0.10988 after the close and weaker if it slips back under it. Invalidation is a 1-hour close below 0.09175.
Base Scenario
Our Hedera price forecast for the base case is continued movement inside the descending channel, with price rotating between 0.09175 and 0.10988 until a 1-hour close lands beyond either edge.
Bearish Scenario
Confirmation is a 1-hour close below 0.09175. The target is 0.08831. It gets stronger if the price loses the lower channel line first and weaker if it reclaims 0.09175 on a 1-hour close.
Crypto Market Context: Derivatives Activity and Open Interest Read
Hedera trend analysis shows open interest at about 5.2% of the $4.43B market capitalization, and futures trading volume of $297.36M is about 3.9 times spot volume of $76.15M. Derivatives lead spot activity here, which can speed up moves around 0.10988 and 0.09175.
Price Target Risks: What Could Invalidate This Channel Setup
A falling channel can persist, so a bounce does not guarantee a breakout. Leveraged positions can trigger sharp 1-hour wicks across the wider crypto market. The ETF report is unverified, and muted inflows may not offset broader weakness in altcoins.
Conclusion: Major Price Levels to Watch Before the Breakout Moves
The token trades at 0.10079, inside its descending channel. A 1-hour close above 0.10988 points to 0.13112 and 0.15021, and a 1-hour close below 0.09175 points to 0.08831. Until one of those closes arrives, treat the breakout as unconfirmed.
Disclaimer: This Breakout Outlook Is Not Financial or Trading Advice
This article is for informational purposes only and is not financial, investment, or trading advice. Crypto assets are highly volatile, so do your own research and manage risk before trading.
