$HBAR is trading near $0.07125, up 2.71% in the last 24 hours, and the price is sitting right at the level that decides what happens next. On the 4-hour chart, it is testing the top of an asc
$HBAR is trading near $0.07125, up 2.71% in the last 24 hours, and the price is sitting right at the level that decides what happens next.
On the 4-hour chart, it is testing the top of an ascending channel near $0.0713. On the daily chart, it is testing a descending channel that has kept $HBAR under pressure for months.
Neither has broken yet, and that is the whole story behind it.
This Hedera price prediction today is tied closely to the ongoing $HBAR technical analysis traders are watching alongside the wider altcoin price prediction picture this week.
Why Is HBAR Suddenly Getting Traders’ Attention?
As per the CoinMarketCap data, the current hedera market cap is at $3.12 billion, up 2.67% on the day, and 24-hour volume climbed 14.39% to $35.17 million.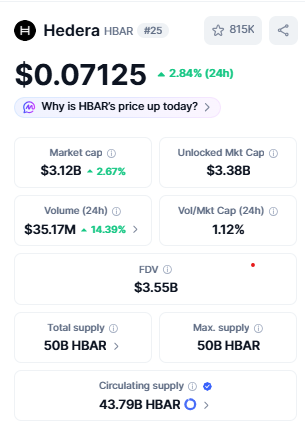
That volume jump is the part worth noting; it means real buying is showing up, not just a quiet drift higher.
$HBAR is up 4.53% over the past week, though the bigger picture still shows scars, down 7.78% over 30 days, 21.16% over 90 days, and 32.96% year to date.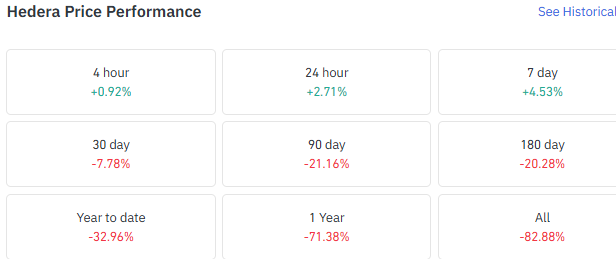
The circulating supply sits at 43.79 billion $HBAR out of a 50 billion maximum supply.
Long, Short, or Trapped? What HBAR Derivatives Show
Open interest is $84.26 million. Positioning leans left across the board.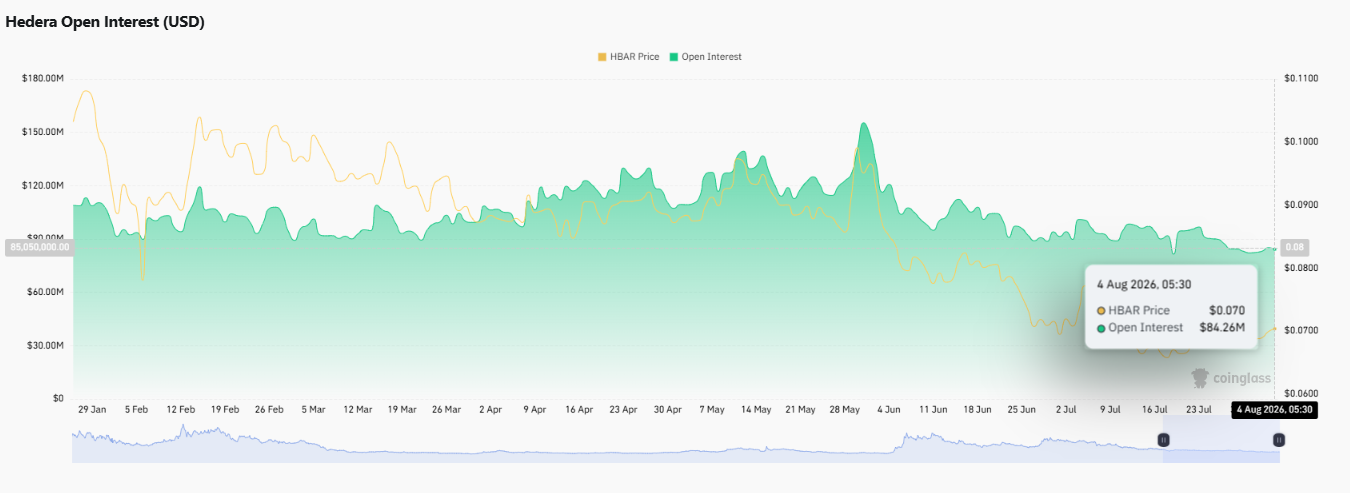
Binance’s HBAR/USDT ratio reads 1.4771, OKX shows 1.61, and Binance’s top trader accounts are even more one-sided at 1.8645.
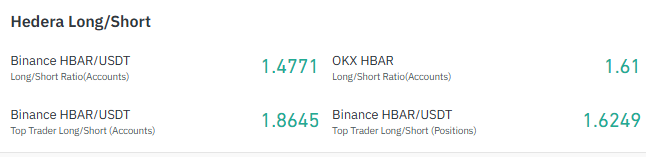
Yet the last 24 hours of liquidations tell a different story than that crowded long book would suggest; shorts took the bigger hit at $10.85K against just $2.65K on the long side.
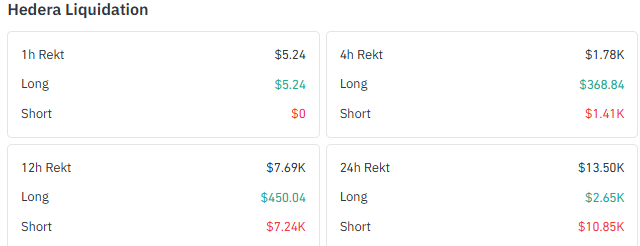
Sellers got caught out as price pushed up, not buyers. Binance leads futures volume at $17.27 million, followed by BingX and LBank near $9 million each.
Data source: coinglass
Can HBAR Finally Break This 4-Hour Ceiling?
$HBAR is inside an ascending channel on the 4-hour chart and is currently testing its upper edge near $0.0713. RSI here reads 64.46, firm but not yet overbought.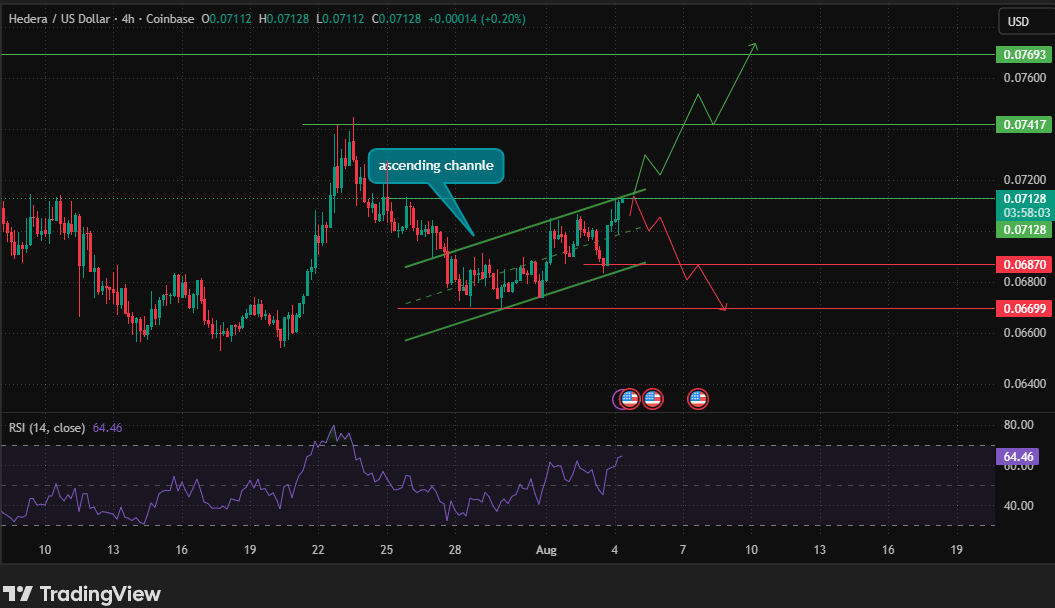
A break above this channel and a sustained move above $0.07128 open the path toward $0.07417 and then $0.07693. If the attempt fails, support sits at $0.06870, and a deeper slide could take price down to $0.06699.
The Daily Chart Hasn’t Said Yes Yet
Zoom out, and HBAR is testing a descending channel on the daily timeframe, the one that has decided where this coin trades for a while now.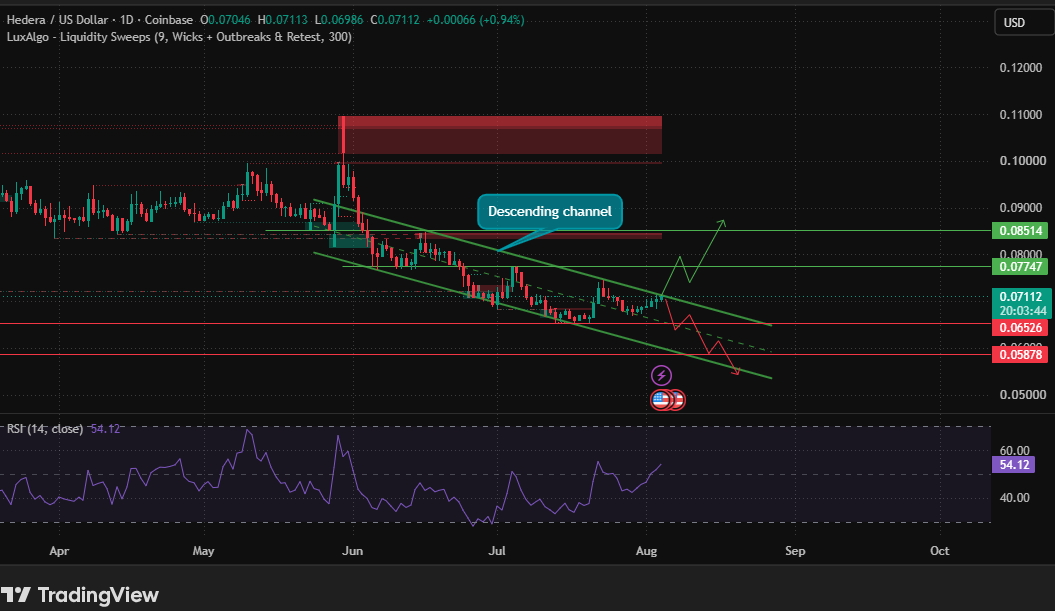
Today’s candle is running at $0.07112, after opening at $0.07046 and ranging between $0.07113 and $0.06986.
A break above the channel points toward $0.07747, and then $0.08514. A failed attempt keeps $0.06526 and $0.05878 as the support zones to watch. Daily RSI sits at 54.12, just above neutral to bullish.
Chart source: TradingView Daily Chart
So, Where Could HBAR Go From Here?
Scenario
4-Hour Chart
Daily Chart
Bullish
Breaks and holds above $0.0713, opening the path to $0.07417, then $0.07693
Breaks above $0.07747, with $0.08514 as the larger target
Base
Chops between $0.06870 and $0.0713 while both levels stay unbroken
Stays inside the descending channel, between $0.06526 and $0.07747
Bearish
Loses $0.06870, sending price toward $0.06699
Slides back toward $0.06526, with $0.05878 as the deeper zone below it
What This Setup Means For HBAR Traders
As per the Coingabbar analyst, in the 4-hour time frame, $HBAR is inside an ascending channel and is testing its high near $0.0713.
A break above this zone opens the way toward $0.07417 and then $0.07693. If the attempt fails, support holds at $0.06870, and a deeper move could take price down to $0.06699.
On the daily chart, $HBAR is testing its long-running descending channel. A break above it points toward $0.07747 and then $0.08514.
If it fails to break out, $0.06526 and $0.05878 remain the levels to watch below. Daily RSI at 54.12 backs a slightly improving tone, without confirming anything bigger just yet.
Disclaimer: This analysis is for informational purposes only and does not constitute financial advice. Cryptocurrency markets are volatile, and readers should conduct their own research before making investment decisions.