Something is stirring in the Hedera price prediction crowd, and it is hard to ignore. HBAR has gone from a quiet chart to one of the more talked-about setups in the last day, and the way it i
Something is stirring in the Hedera price prediction crowd, and it is hard to ignore. HBAR has gone from a quiet chart to one of the more talked-about setups in the last day, and the way it is moving has traders checking the chart every few minutes.
No personal position is held here; this is a straight read of the chart and the numbers below.
Hedera Price Today: Live Data and Market Snapshot
HBAR is priced at $0.08705, up 8.12% on the day. Futures volume over 24 hours sits at $360.76M against spot volume of $109.00M, showing this move has real derivatives participation behind it, not just spot buying.
Market cap stands at $3.84B with open interest at $148.46M. Circulating supply is 43.83B HBAR out of a 50.00B total and max supply.
(Source: CoinGlass, Sep 21, 2026)
Hedera News Today: Fixed Fees Are you the talking point
The Hedera news today worth flagging is about something most chains do not offer: cost certainty. 
BSCN pointed out that Hedera prices its transaction fee in US dollars rather than tokens, with gas set at a flat $0.0001.
That fee stays constant regardless of how busy the network gets, which is a meaningful differentiator when other chains see gas spike during high-traffic periods.
For a network being pitched toward enterprise and payments use cases, that kind of predictability is exactly the sort of detail that gets quoted in boardrooms, not just crypto Twitter.
(Source: X post by BSCN, Sep 20, 2026)
Quick Take
CMP: 0.08697 (1h chart)
Trigger level: close above 0.08993 confirms bullish continuation
Failure level: close below 0.07946 confirms bearish breakdown
Data timestamp: Sep 21, 2026, 1h Binance perpetual chart
Risk note: levels are close-based, not wick-based; a stray spike through a line without a close does not confirm anything
Hedera Price Prediction 2026 Technical Analysis
On the 1-hour Binance perpetual chart, HBAR has been climbing off an ascending trendline that has caught every dip since price first found its footing lower down the chart. 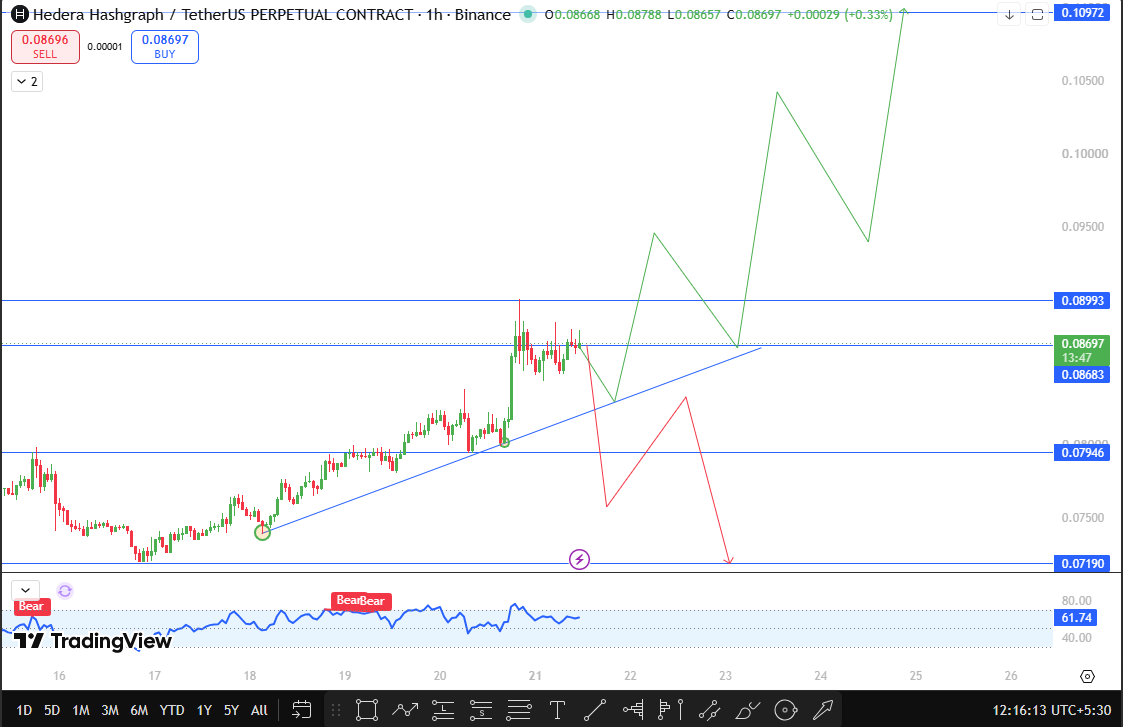
The latest bounce off that line has carried $HBAR right up against 0.08993, a level that has capped the last few pushes higher.
This is the zone that matters most for the current Hedera technical analysis picture.
A confirmed 1h close above 0.08993 would flip it from resistance into support and clear the way toward 0.10972, a level that would also mark a fresh short-term high if reached.
Given how sharply HBAR has already moved today, that kind of follow-through would not be a huge surprise if buyers stay in control.
The trendline itself is the level that defines whether this stays a bullish HBAR price prediction at all. As long as price keeps finding support along it, dips look more like entries than warnings.
But a break below 0.07946 on a closing basis would be the first real sign that momentum is fading, and that would put 0.07190 back in play as the next spot buyers would likely step in.
The RSI on this chart has swung between Bear and Bull tags through recent sessions and currently sits near 62, leaning firm without being stretched. That leaves genuine room for $HBAR to extend either way once one of these two closes actually happens.
Hedera Support and Resistance Levels to Watch
Level
Price
Distance From CMP
Resistance 2
0.10972
26.16% above
Resistance 1 (flip zone)
0.08993
3.40% above
CMP
0.08697
—
Support 1
0.07946
8.63% below
Support 2
0.07190
17.32% below
Bull Case, Base Case, And Bear Case For HBAR
In the bull case, HBAR clears 0.08993 on a confirmed close, the trendline keeps absorbing dips, and the fixed-fee narrative keeps drawing fresh attention toward payments-focused use cases, carrying the price toward 0.10972.
In the base case, HBAR stalls just under 0.08993 for a stretch, testing it repeatedly without a clean break. A Hedera price forecast built around this range would want a decisive close outside it before treating either target as live.
In the bear case, the trendline finally breaks on a closing basis, HBAR slips below 0.07946, and the move gives back a chunk of today's gain toward 0.07190. Given how much of today's volume has come from futures, a break like that could move fast once leveraged longs start unwinding.
Hedera Price Prediction 2030
Fast forward to 2030, and the thing that stands out about Hedera is not the price chart; it is the fee model.
A network that can promise a flat $0.0001 transaction cost no matter how congested it gets is solving a problem that most chains still have not cracked, and that is exactly the kind of predictability payment processors and enterprises look for before committing volume.
If that pitch keeps landing the way it has been, HBAR in the $0.60 to $1.20 range by 2030 is a realistic outcome, not a moonshot number pulled from nowhere.
Risks To Watch
A move this fast on 8%+ daily gains can attract just as much profit-taking as it does new buyers.
The fixed-fee story is strong, but it needs continued enterprise adoption to actually move the needle on price. Every level in this Hedera price prediction should be treated as conditional on a real close, not a brief touch.
Glossary
Trendline: A line connecting a series of highs or lows used to gauge trend direction.Flip Zone: A price area that flips from resistance to support (or vice versa) once broken and closed through.Break And Close: A price move that closes beyond a level on the relevant timeframe, rather than just wicking through it.Open Interest: The total value of outstanding derivative contracts still open on an asset.CMP: Current market price, taken directly from the live chart.
Disclaimer
This article is for informational purposes only and does not constitute financial advice. Cryptocurrency markets are volatile, and readers should do their own research before making any investment decisions.