Gold and silver are getting hit hard again, and the selloff has now become even deeper than it looked a day ago. More than $500 billion in combined market value was reportedly erased from gol
Gold and silver are getting hit hard again, and the selloff has now become even deeper than it looked a day ago.
More than $500 billion in combined market value was reportedly erased from gold and silver during one six-hour stretch as both metals accelerated lower. That figure should be treated as an estimate based on the size of the two markets rather than an official exchange tally, but the price damage itself is undeniable.
Gold has now fallen toward roughly $4,015-$4,025 per ounce, after dropping to its lowest level since July 20. The metal is down around 3.5% for the week and is heading toward its worst weekly performance in more than four months.
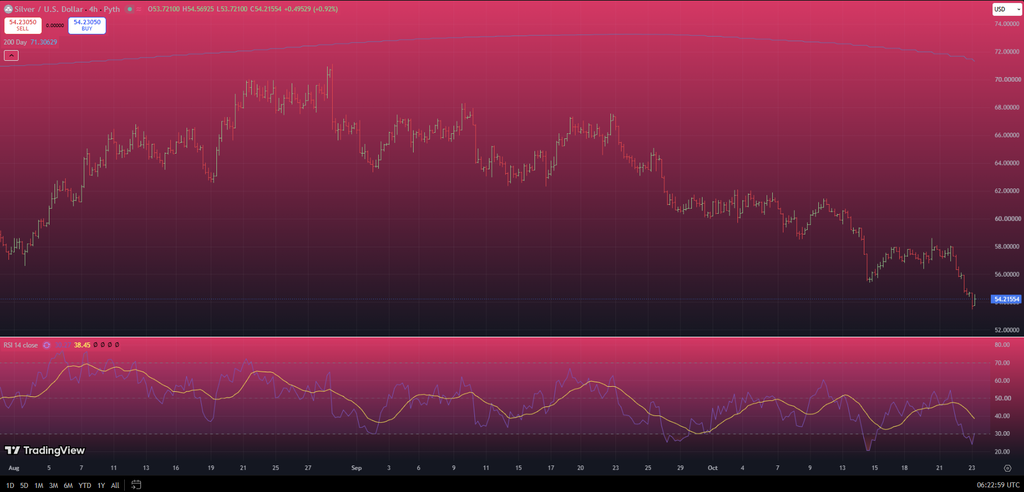
Silver has been hit even harder. Spot prices dropped below $54 during early October 23 trading, extending a decline that has already erased much of the metal’s recent recovery.
This is happening only days before the Federal Reserve’s October 27-28 meeting, with oil prices remaining elevated and markets increasingly concerned that inflation could keep U.S. interest rates high for longer.
The result is a difficult combination for precious metals: persistent inflation risk, restrictive monetary policy, elevated Treasury yields and a strong dollar.
Why Are Gold and Silver Falling So Hard?
The immediate macro problem remains energy.
Oil prices have stayed elevated as geopolitical tensions in the Middle East continue to threaten supply. That has revived concerns that another energy-driven inflation wave could make it difficult for the Federal Reserve to turn toward easier monetary policy.
Normally, geopolitical tension can help gold through safe-haven demand.
This time, however, the inflation impact of expensive oil appears to be overpowering that benefit.
More expensive energy can filter into headline inflation and inflation expectations. If traders expect inflation to stay elevated, they also have to price the possibility that the Fed keeps rates high for longer or tightens again later this year.
Markets still broadly expect the Federal Reserve to leave rates unchanged at the October meeting, but expectations for another increase in December remain high.
That is bad news for gold and silver because neither metal produces yield.
When Treasury securities offer yields around 5%, investors have an attractive alternative to holding non-yielding assets.
The U.S. dollar can benefit from the same rate expectations, creating additional pressure on dollar-priced metals.
So even though persistent inflation can strengthen the long-term argument for owning hard assets, traders are currently focused on the more immediate consequence: restrictive interest rates.
Gold Price Is Now Dangerously Close to $4,000
This is the biggest change since yesterday.
Gold was still trading around $4,085 when we first looked at the selloff.
It has now moved another roughly $60-$70 lower and is trading only around 0.4%-0.6% above the psychological $4,000 level.
That makes $4,000 the obvious level to watch.
The previous $4,070-$4,080 support region has already failed to stop sellers. Gold has also moved beneath the $4,040 area that previously looked like the next technical floor.
A clean break below $4,000 could expose the upper-$3,900 region and potentially trigger another wave of stop-loss selling.
On the upside, the old support levels now become resistance.
Gold would first need to recover approximately $4,040-$4,075 before I would start taking a short-term rebound seriously.
Above there, roughly $4,120-$4,150 becomes the next recovery area.
Personally, this is also where the market becomes much more interesting to me.
I have previously said I would like to see gold fall below $4,000 before considering gradual accumulation. We are now extremely close to that area.
That does not mean I would automatically buy the first print below $4,000. I would still prefer to see price stabilize and selling momentum start fading.
Silver Price Is Taking the Bigger Percentage Hit
Silver’s decline remains even more aggressive than gold’s.
That is not particularly surprising.
Silver trades as both a precious metal and an industrial commodity. It therefore carries some of gold’s sensitivity to rates and the dollar, but it also reacts to expectations for economic growth and industrial demand.
 Source: TradingView
When markets become nervous about restrictive monetary policy, silver can get squeezed from both sides.
The $55-$55.50 region we were watching has now been broken, with early October 23 prices slipping below $54.
That changes the short-term setup.
The next area I would watch is roughly $53-$54. If sellers push decisively through that region, $50 becomes increasingly relevant as both a technical and psychological target.
For a recovery, silver first needs to reclaim $55-$56.
Beyond that, $57-$58 would represent the next larger resistance region.
Silver is therefore no longer simply retesting support.
It is searching for a new support zone.
Read also: This Silver Price Prediction Is Almost Impossible to Believe
The Fed Is Now the Biggest Event on the Calendar
The selloff is occurring at an awkward moment.
The October Fed meeting is approaching, but investors already expect policymakers to stand still. That means the rate decision itself may not be the most important part of the event.
What traders really want to know is what happens in December.
If Fed officials keep the door open to another increase and continue emphasizing inflation risks, real yields could remain elevated and gold and silver may struggle to establish sustainable recoveries.
Upcoming PCE inflation data will also be important because it is the Fed’s preferred inflation gauge.
A softer reading could give metals some relief.
Another hot print would strengthen the case for restrictive policy and could make the $4,000 gold level even harder to defend.
For now, sellers clearly remain in control.
Metal
Current area
Next support
Recovery level
Gold
~$4,015-$4,025
$4,000, then ~$3,950
$4,040-$4,075, then $4,120+
Silver
Below ~$54
$53, then $50-$52
$55-$56, then $57-$58
The most important difference from yesterday is that gold has now nearly reached the level everyone can see.
$4,000.
Breaking it could trigger another emotional leg lower as traders begin questioning where the correction actually ends.
Holding it, especially after such a fast decline, could create the conditions for a meaningful relief bounce.
So why are gold and silver prices getting wrecked right now?
There is still no single dramatic trigger.
The market is repricing the combination of expensive oil, persistent inflation, another potentially hawkish Fed meeting, elevated Treasury yields and a strong dollar.
And after enormous rallies earlier in 2026, both metals still have profitable positions available to liquidate when the macro environment turns hostile.
The difference now is that the selloff has moved from an ordinary correction into a test of psychologically critical levels.
For the gold price, that level is $4,000.
For silver, the question is whether buyers finally appear somewhere in the low-$50s.
For more financial news and price predictions, click here.
Subscribe to our YouTube channel for daily crypto updates, market insights, and expert analysis.
The post Here’s Why Gold and Silver Prices Are Getting Wrecked Right Now appeared first on CaptainAltcoin.