Gold and silver prices took a hit on July 31, with both metals reversing sharply after failing to hold key resistance levels. Gold opened near $4,103 , briefly pushed to $4,112 , and then col
Gold and silver prices took a hit on July 31, with both metals reversing sharply after failing to hold key resistance levels. Gold opened near $4,103 , briefly pushed to $4,112 , and then collapsed to an intraday low of $4,021; a peak‑to‑trough decline of roughly $90 per ounce (2.21%). The metal closed at $4,045 , down 1.42% for the session.
Silver was hit even harder. It opened near $59.00 , briefly touched $59.17 , and then sold off to $57.05 – a decline of $2.11 per ounce (3.57% from the high). It closed at $57.62 , down 2.35% .
Silver fell approximately 1.65 times as much as gold in percentage terms. That is typical during a risk‑off precious‑metals liquidation, since silver price is more volatile and trades as both a monetary metal and an industrial commodity.
The Macro Driver: Rising Bond Yields
The immediate pressure came from a sharp rise in long‑term Treasury yields. The 30‑year Treasury yield surged to roughly 5.27% , its highest level since 2007, as markets priced in a greater probability that the Fed may have to tighten policy further.
When real yields rise, bonds become more attractive, the opportunity cost of holding non‑yielding assets like gold increases, and the dollar often strengthens. Gold and silver frequently face selling pressure in that environment.
That is exactly what happened.
The Chart That Explains the Bigger Picture
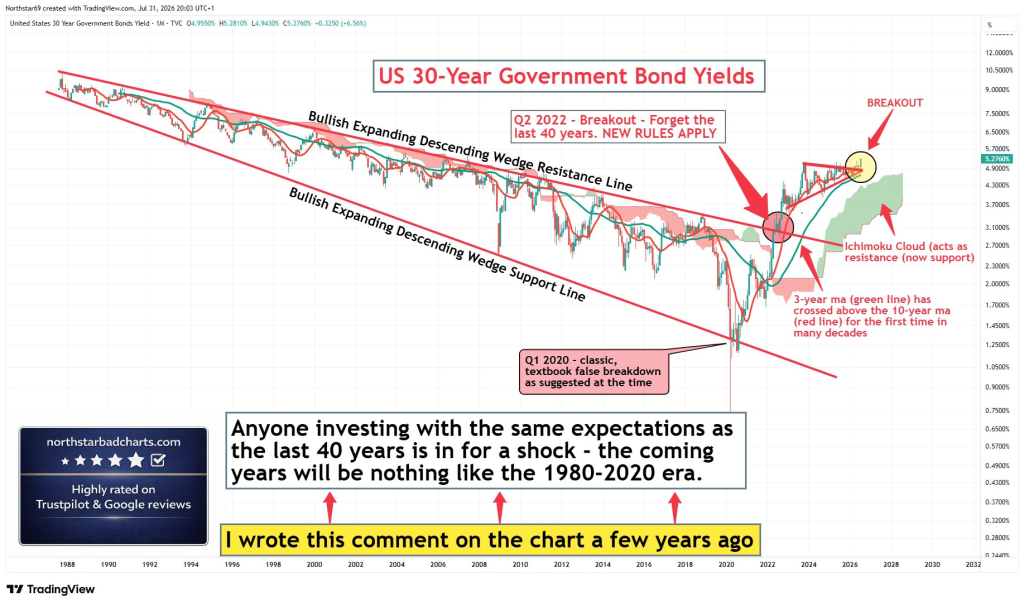
SilverTrade shared a chart that makes a structural macro argument, not a short‑term trading call. The thesis is that the multi‑decade bond bull market ended in 2022, and that persistently higher long‑term Treasury yields are becoming the new regime.
 Source: X/@silvertrade
Key observations from the chart:
- A 40‑year downtrend in yields was broken. From the early 1980s until 2022, U.S. 30‑year Treasury yields stayed inside a massive falling channel. In Q2 2022, yields broke above that long‑term resistance. The annotation “Forget the last 40 years. New rules apply” reflects the belief that secular disinflation has ended.
- Bullish expanding descending wedge. The author interprets the decades‑long pattern as a bullish expanding wedge. The COVID crash below support in 2020 is labeled a “false breakdown.” Price subsequently reclaimed the pattern and broke higher.
- Long‑term trend confirmation. The 3‑year MA has crossed above the 10‑year MA for the first time in decades. The Ichimoku cloud has flipped from resistance to support. Current yields are pressing against 5.2‑5.3% , a major resistance area.
The implication is that the author expects 30‑year yields eventually to exceed 5.3% and continue much higher.
Read also: ChatGPT Predicts Where Silver Price Could Go in August
The Counterintuitive Thesis: Rising Yields Could Become Bullish for Gold
This is the interesting part.
Historically, higher yields mean lower gold. But that relationship only holds when inflation is under control, investors trust central banks, and rising yields reflect stronger real growth.
SilverTrade argues we are entering a different regime. The thesis is:
- Government debt is becoming too large.
- Treasury issuance keeps increasing.
- Long‑term yields rise because investors demand greater compensation for owning government debt.
- Higher yields eventually create financial stress.
- Central banks are forced back toward liquidity injections or yield curve control.
- Gold and silver begin rising alongside yields rather than falling because both become expressions of deteriorating sovereign debt confidence.
This is similar to what occurred during parts of the 1970s, when bond yields rose, inflation stayed elevated, and gold still exploded higher. In that environment, nominal yields were rising but real yields remained unattractive.
Silver fell approximately 1.65 times as much as gold in percentage terms. That is typical during a risk‑off precious‑metals liquidation. Silver is more volatile because it trades as both a monetary precious metal and an industrial commodity.
When traders reduce precious‑metals exposure quickly, silver frequently experiences larger percentage moves because its market is smaller and less liquid than gold’s.
The Analyst’s Caution
SilverTrade is not calling for an immediate reversal. The chart shows that yields are pressing against a major resistance zone, and a decisive break above 5.3% would confirm the structural shift. Until that happens, the traditional relationship between yields and precious metals may continue to weigh on prices.
But the author is also pointing out a potential long‑term opportunity. If yields break higher and the regime shift is confirmed, the inverse correlation between yields and gold price could eventually flip. In that environment, gold and silver could rally even as yields rise.
Overall, The sell‑off on July 31 was a textbook macro move: yields rose, the dollar strengthened, and precious metals got hit. Silver fell harder than gold, as it always does in these conditions.
But the chart SilverTrade shared raises a longer‑term question. If the 40‑year bond bull market is truly over, the relationship between yields and precious metals may not hold forever. In a world of rising sovereign debt and deteriorating confidence in fiat currencies, gold and silver could eventually decouple from yields.
FAQs
Why are gold and silver prices down today
The 30‑year Treasury yield surged to 5.27%, its highest level since 2007. Higher yields increase the opportunity cost of holding non‑yielding assets like gold and silver.
Why did silver fall more than goldSilver fell 2.35% versus gold’s 1.42%. Silver is more volatile because it trades as both a monetary metal and an industrial commodity.
Could rising yields become bullish for goldYes. If the 40‑year bond bull market is over, rising yields could reflect deteriorating confidence in sovereign debt. In that scenario, gold and silver could rally alongside yields.
Subscribe to our YouTube channel for daily crypto updates, market insights, and expert analysis.
The post Here’s Why Gold and Silver Sold Off Today (And Why That Could Reverse Soon) appeared first on CaptainAltcoin.