Gold and silver are on fire right now. The gold price rose over 2.4% in the last day, trading near $4,441. The volume also doubled. People are piling in. Silver’s not far behind, up 2.3%, mov
Gold and silver are on fire right now. The gold price rose over 2.4% in the last day, trading near $4,441. The volume also doubled. People are piling in.
Silver’s not far behind, up 2.3%, moving around $64.85.
Why Are Gold and Silver Prices Pumping?
The biggest fresh catalyst is the U.S. Treasury’s decision to at least double the size of its long-end liquidity-support buybacks. From September 9, the maximum operation size for 10–20-year and 20–30-year nominal Treasury securities will rise from $2 billion to at least $4 billion per operation.
That announcement pushed the Treasury yield curve lower and helped create a more supportive environment for precious metals. Lower bond yields reduce the opportunity cost of holding non-yielding assets such as gold and silver. At the same time, the weaker U.S. dollar has provided another boost.
That explains why the gold price jumped above $4,400, reaching about $4,459.98 on the chart, and why the silver price climbed back toward $65. The reaction is especially notable in gold, where trading momentum has pushed RSI to 64.87, compared with silver’s 54.67.
The Fed minutes are the next major test. If they reinforce expectations for easier monetary policy, gold and silver could receive another boost through lower yields and a weaker dollar.
So yes, the Treasury buyback announcement should be presented as the primary reason for the immediate spike, with the weaker dollar, easing yields and Fed minutes as additional factors.
More News That Could Drive Gold and Silver Prices This Week
The market calendar keeps the focus on U.S. macro data. FOMC Meeting Minutes are due at 6:00pm CET, followed by President Trump speaking at 6:30pm CET later today.
The Philly Fed Manufacturing Index and Unemployment Claims are also due tomorrow, with the figures provided at 24.1 and 210K respectively.
These releases matter because softer economic data could reinforce expectations for lower rates, potentially helping the gold price and silver price extend their advances. Stronger data could create the opposite reaction through Treasury yields and the dollar.
Here’s What the Gold and Silver Charts Are Showing
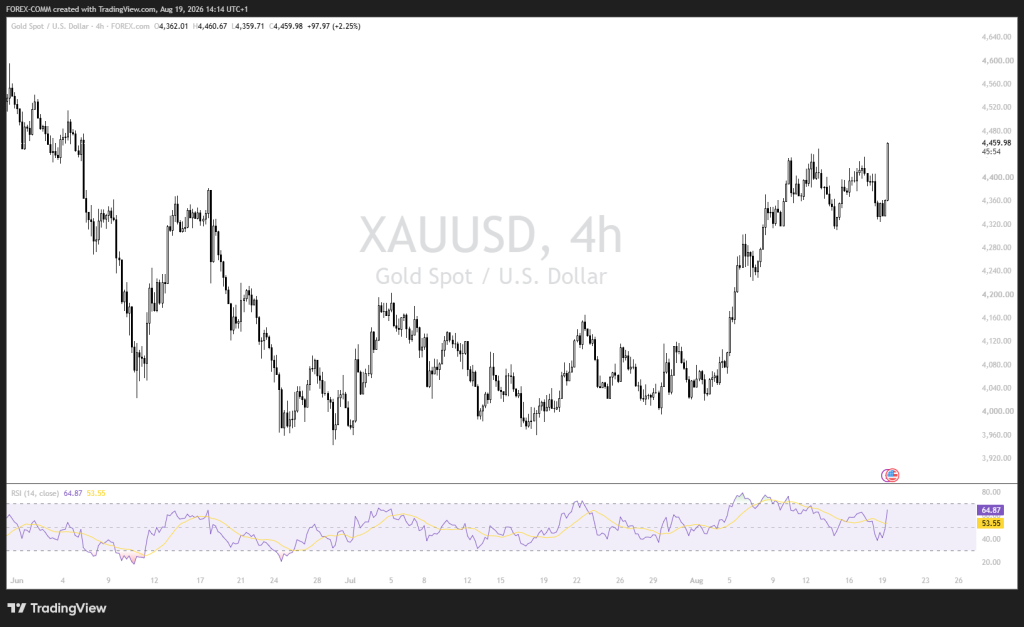
We had a look at the gold chart, and buyers regained control after the metal climbed from the $4,000 area in late July to a current chart price near $4,459.98.
 Source: Tradingview.com
Gold’s RSI is 64.87. Its signal line is 53.55. So momentum is above the middle line, but not near 70 yet, that’s the overbought mark.
First ceiling is $4,460. If that breaks, next ones are $4,480 and $4,520. On the downside, $4,420 is the first floor. If that gives way, $4,380 comes next.
Related Gold News: Here’s Why Gold Price Is Moving So Fast Right Now
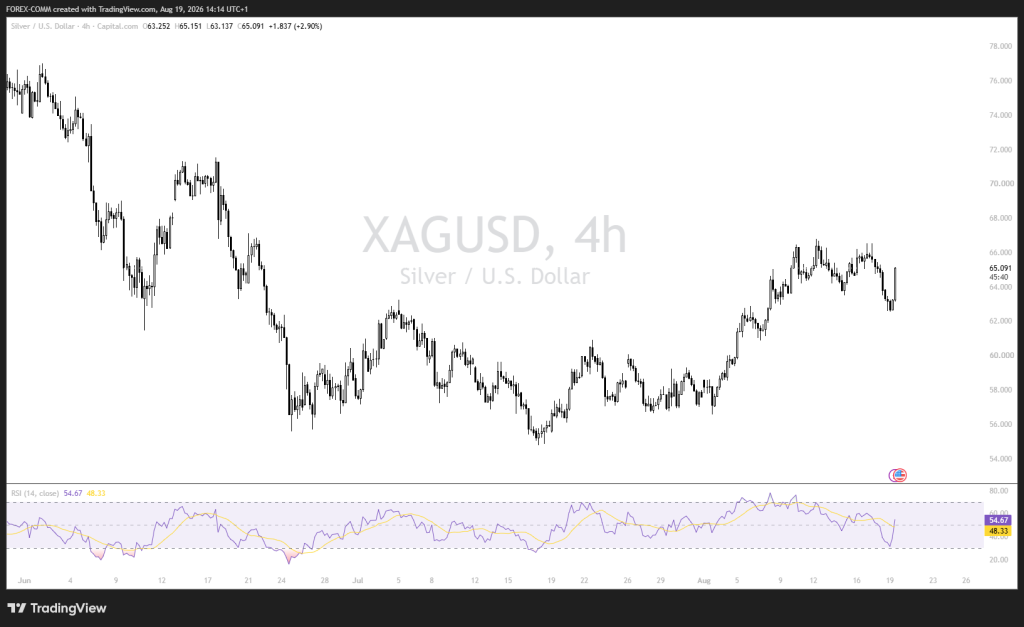
Silver also It bounced hard off its June low around $56. Now it’s up near $64.85. That’s a solid recovery. After reclaiming $60 and $62, silver climbed toward $66 but has struggled to break that level decisively. The price is now around $65.09, making $66 the key resistance. Above it, $68 and $70 become the next targets.
 Source: Tradingview.com
Silver’s RSI is 54.67, with its signal average at 48.33. The indicator remains above 50, showing positive momentum, but there is still room before reaching overbought territory. Support comes in at $64, then $62 and $60. A move below $62 would weaken the current bullish structure.
Where Could Gold and Silver Prices Go Next?
For gold, the bullish path is a break above $4,460. From there, $4,480 comes next, then $4,520. The base path keeps gold moving between $4,420 and $4,460, building up for another breakout attempt. The bearish path starts if gold loses $4,420. That would open up $4,380, then $4,320.
For the silver price, the bullish path begins with a confirmed move above $66. That would put $68 and then $70 in play. The base path has silver trading between $64 and $66, waiting for a clearer direction. The bearish path kicks in below $64, exposing $62 and then $60.
The main difference comes down to momentum. Gold’s RSI is 64.87, while silver’s is 54.67. That tells you the gold price has stronger buying pressure right now. So gold has the better short-term setup. But silver has more room to run before hitting overbought territory.
Frequently Asked Questions
Why are gold and silver prices rising
Gold and silver are benefiting from a weaker U.S. dollar, easing bond yields, Treasury buyback plans, and uncertainty around the Federal Reserve’s next rate decision.
What is the next target for the gold priceThe gold price is testing $4,460. A break above this level could open the way toward $4,480 and $4,520, with $4,420 acting as key support.
Can the silver price reach $70Yes. The silver price is testing the $66 resistance area. A sustained break above $66 could put $68 and then $70 in focus, provided support around $64 holds.
Subscribe to our YouTube channel for daily crypto updates, market insights, and expert analysis.
The post Here’s Why Silver and Gold Prices Are Pumping Right Now appeared first on CaptainAltcoin.