Bitcoin is often the first asset people name when they ask what a small sum could become. The data from the past decade shows a very large gain for buyers who held on. It also shows price dro
Bitcoin is often the first asset people name when they ask what a small sum could become. The data from the past decade shows a very large gain for buyers who held on. It also shows price drops that tested nearly every holder.
This article draws on figures from Bitbo, The Motley Fool, CNBC Make It, BitradeX and Pocket Option. Every number comes from those pages unless the text says it was calculated. Where the sources disagree, the article says so.
The sections below cover the current price, the 10-year result, returns by buy date, risk, and the math behind the next 10 years. The article is for information only and is not financial advice.
Where Bitcoin Trades Today
Bitbo lists the Bitcoin price at $81,005 on October 15, 2026. The Motley Fool showed $80,944 on the same day, down 3.3%, or $2,753.65, from the day before. The small gap likely comes from the time each site took its price.
The Motley Fool puts Bitcoin’s market value at about $1.6 trillion. The day’s trading range ran from $80,444 to $83,005, and volume was 40.4 billion. Over 52 weeks, the price has ranged from $57,945.16 to $116,041.09.
Using Bitbo’s price, Bitcoin sits about 39.8% above its 52-week low. It is also about 30.2% below its 52-week high. These two percentages were calculated for this article.
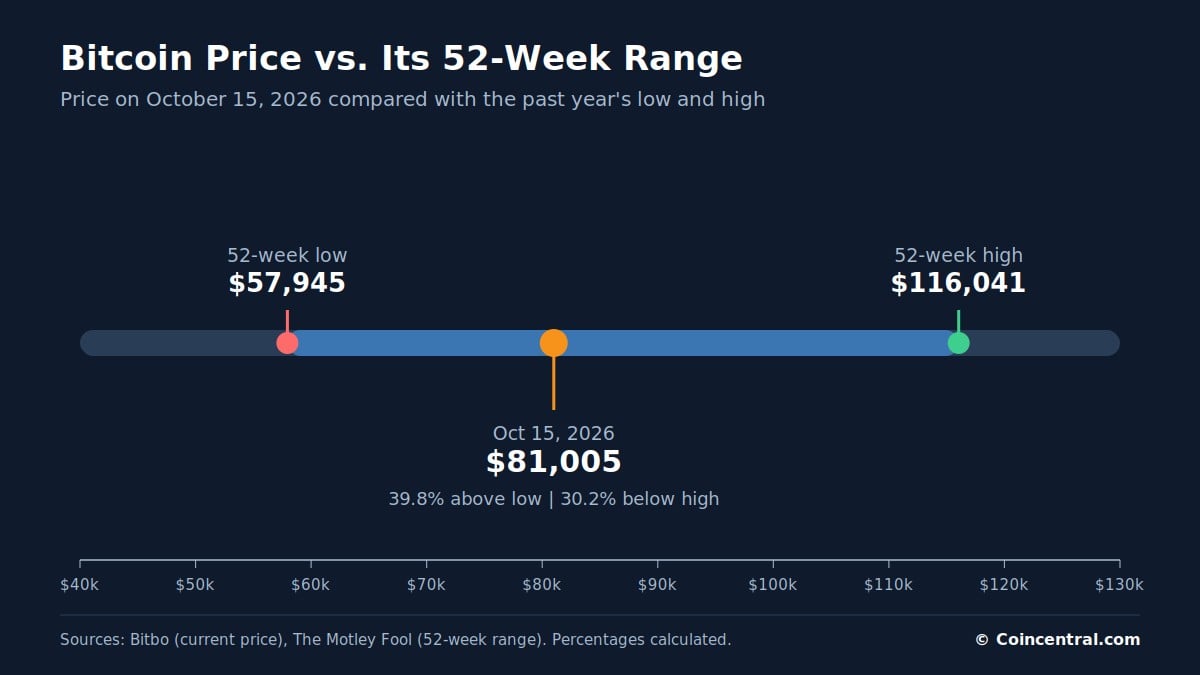
Figure 1: Bitcoin’s price on October 15, 2026 against its 52-week low and high.
The high is roughly double the low, which shows how wide the range has been in one year. A Motley Fool headline from October 14, 2026 says Bitcoin just posted its best third quarter since 2017. The article text was not part of the material reviewed, so no further detail is given.
BitradeX reports that Bitcoin traded above $120,000 in October 2025. It says the price then fell below $60,000 by early June 2026. That peak is above the Motley Fool’s 52-week high of $116,041.09.
The sources do not explain the gap. The 52-week window starts in mid-October 2025, so an early October peak may fall just outside it. Readers who need exact highs should check a live price feed.
Table 1: Bitcoin price snapshot, October 2026
Metric
Value
Source
Price, October 15, 2026
$81,005
Bitbo
Price, same day
$80,944
The Motley Fool
One-day change
-3.3% (-$2,753.65)
The Motley Fool
Market value
$1.6 trillion
The Motley Fool
Day’s range
$80,444 to $83,005
The Motley Fool
Volume
40.4 billion
The Motley Fool
52-week low
$57,945.16
The Motley Fool
52-week high
$116,041.09
The Motley Fool
Price in October 2025
Above $120,000
BitradeX
Price in early June 2026
Below $60,000
BitradeX
The 10-Year Result for a $1,000 Investment
The Motley Fool looked at a $1,000 purchase made on September 3, 2016. By its math, that sum would be worth about $126,810 today. The article says $1,000 bought about 1.7 Bitcoin at the time.
That is a gain of about 12,581%, which works out to an annual rate near 62%. The Motley Fool’s key points list the gain as 12,381%, but the text and the math support 12,581%. The figures leave out trading fees and taxes.
The Motley Fool compared that rate with other assets using YCharts data. Bitcoin’s 62% annual rate was well above the Nasdaq Composite at about 18%, the S&P 500 at about 14%, and gold at about 13%.
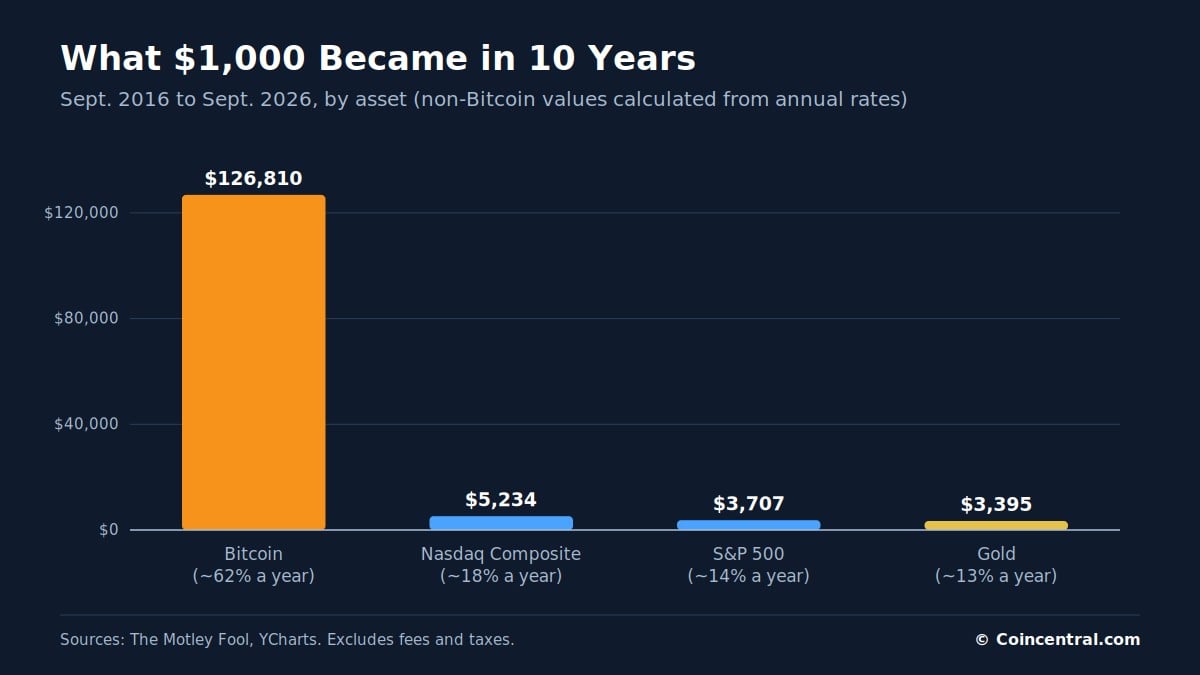
Figure 2: Value of $1,000 after 10 years, Bitcoin compared with the Nasdaq, S&P 500 and gold.
Applying those yearly rates for 10 years, $1,000 would grow to about $5,234 in the Nasdaq, $3,707 in the S&P 500, and $3,395 in gold. These figures were calculated for this article. Bitcoin’s result is about 24 times the Nasdaq figure.
Table 2: Annual returns and 10-year value of $1,000, September 2016 to September 2026
Asset
Annual return
Value of $1,000
Bitcoin
About 62%
About $126,810
Nasdaq Composite
About 18%
About $5,234 (calculated)
S&P 500
About 14%
About $3,707 (calculated)
Gold
About 13%
About $3,395 (calculated)
Pocket Option gives a shorter-term view. It lists five-year returns of about 700% for Bitcoin, 70% for the S&P 500 and 30% for gold. It rates the risk of each as high, medium and low.
Table 3: Five-year returns and risk, as listed by Pocket Option
Asset
Return (5 years)
Risk
Liquidity
Bitcoin
About 700%
High
High
S&P 500
About 70%
Medium
High
Gold
About 30%
Low
High
The Motley Fool author adds a warning. The same article says it is highly unlikely that future returns will come close to those of the past. The author still sees Bitcoin as a fit for a small part of a balanced portfolio.
Returns by Purchase Date
The date of purchase changes the result a great deal. Bitbo’s calculator shows what $1,000 invested at different dates would be worth at today’s price of $81,005. It also reports an all-time compound annual growth rate of 191.4%.
A $1,000 purchase in January 2015 would be worth $257,199, a gain of 25,619.9%. A purchase in January 2017 would be worth $81,151. A purchase in January 2013 would be worth about $6.1 million.
Bitbo’s headline example goes back further. $100 invested in July 2010 would be worth $137.3 million, a return of 137,296,289.8%. Its table shows the same purchase as $1.4 billion for $1,000, which is the same result scaled to a larger amount.
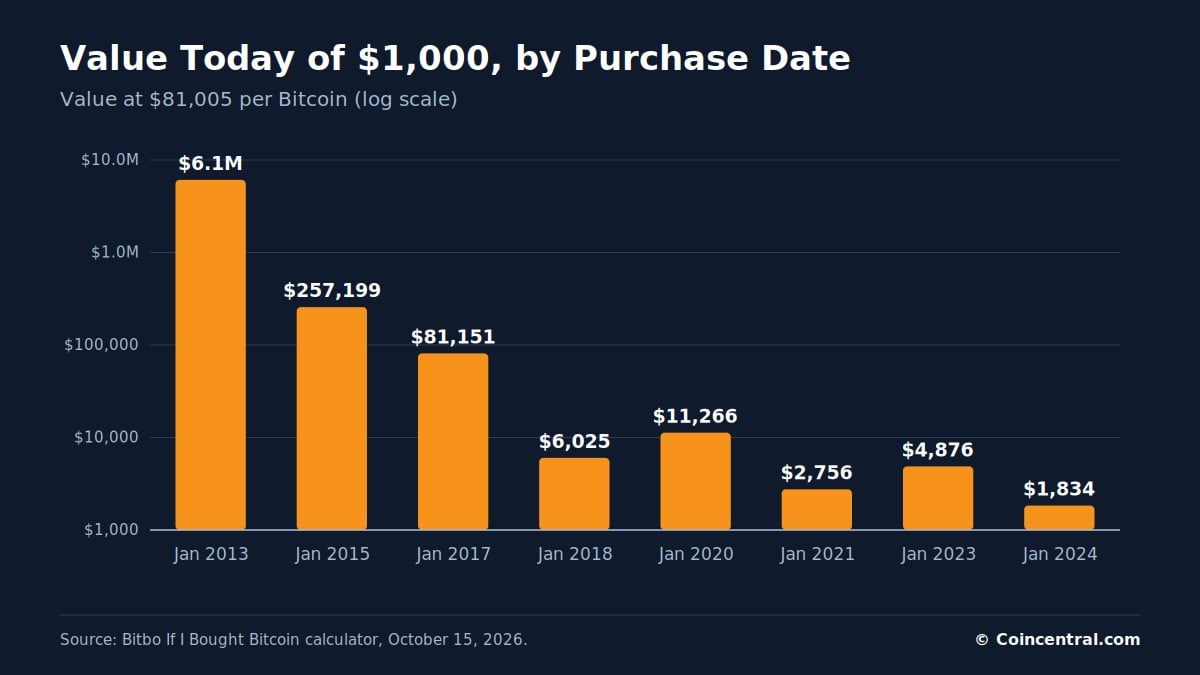
Figure 3: Today’s value of $1,000 invested in Bitcoin on selected January dates, shown on a log scale.
Later buyers saw smaller gains. A January 2018 purchase at $13,444.88 is worth $6,025, a gain of 502.5%. A January 2021 purchase at $29,388.94 is worth $2,756, a gain of 175.6%.
The smallest gain in Bitbo’s table belongs to a January 2024 buyer. That $1,000 purchase at $44,161.95 is now worth $1,834, a gain of 83.4%. Every start date in the table shows a profit at today’s price.
Table 4: Value today of $1,000 invested on each date (Bitbo)
Date
BTC price
BTC bought
Value today
Return
Jul 2010
$0.06
16,949.1525
$1.4B
+137,296,289.8%
Jan 2013
$13.22
75.6430
$6.1M
+612,644.9%
Jan 2015
$314.95
3.1751
$257,199
+25,619.9%
Jan 2017
$998.20
1.0018
$81,151
+8,015.1%
Jan 2018
$13,444.88
0.0744
$6,025
+502.5%
Jan 2020
$7,189.94
0.1391
$11,266
+1,026.6%
Jan 2021
$29,388.94
0.0340
$2,756
+175.6%
Jan 2023
$16,613.87
0.0602
$4,876
+387.6%
Jan 2024
$44,161.95
0.0226
$1,834
+83.4%
The table also shows how fast the price moved between dates. The January 2018 price was about 13.5 times the January 2017 price of $998.20. This ratio was calculated from Bitbo’s figures.
These are January snapshots. They do not show the drops that happened between those dates, which the later section on price swings covers.
One, Five and Ten Year Windows
CNBC Make It ran a similar test in February 2024. It used a Bitcoin price of $51,793 on February 14. At that price, $1,000 invested a year earlier would have grown 133% to about $2,331.
A five-year hold would have grown 1,352% to about $14,524. A 10-year hold would have grown 7,644% to about $77,443. Someone who bought on January 11, 2024, the day spot Bitcoin ETFs launched, would have had $1,113.
CNBC compared these results with the S&P 500. The index was up about 21% over 12 months, about 82% since 2019 and about 172% since 2014. On $1,000, that equals about $1,210, $1,820 and $2,720, using values calculated for this article.
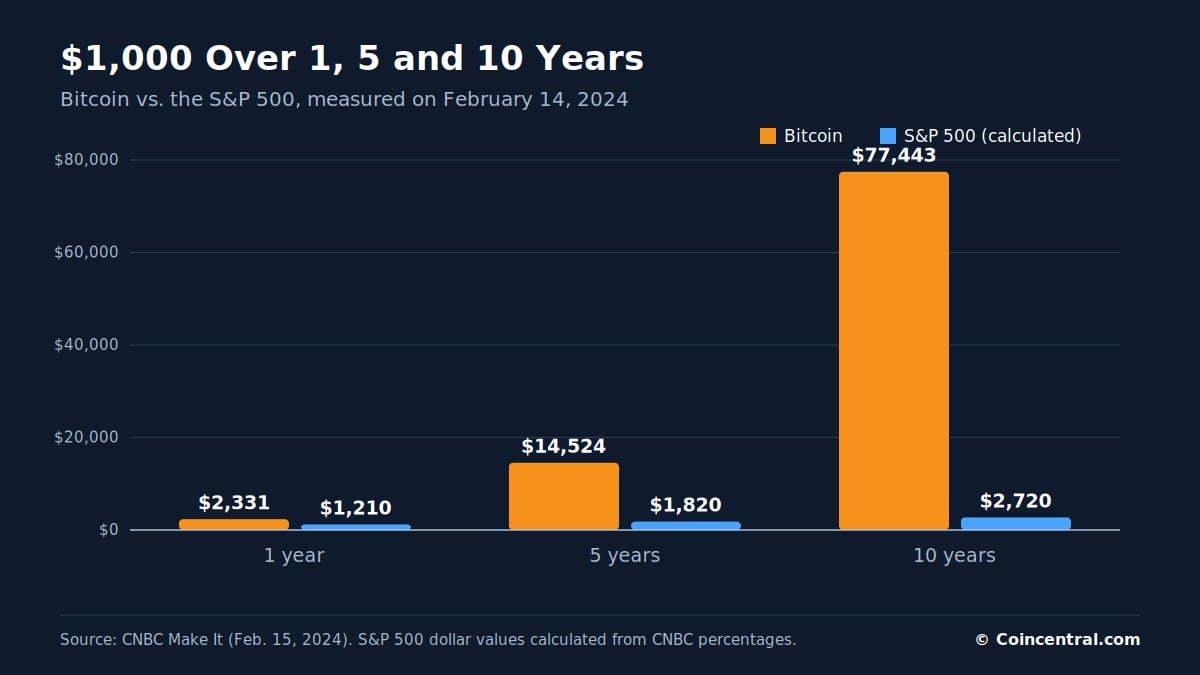
Figure 4: Value of $1,000 over one, five and 10 years, Bitcoin against the S&P 500, as of February 14, 2024.
Table 5: Bitcoin and the S&P 500 over three windows, February 14, 2024
Window
Bitcoin gain
Bitcoin value
S&P 500 gain
S&P 500 value
Since ETF launch (Jan 11, 2024)
+11.3%
$1,113
Not given
Not given
1 year
+133%
$2,331
+21%
$1,210
5 years
+1,352%
$14,524
+82%
$1,820
10 years
+7,644%
$77,443
+172%
$2,720
The 10-year figure has changed with time and with the start date. CNBC’s 10-year value was $77,443 in February 2024, and the Motley Fool’s was $126,810 in September 2026, about 64% higher. The two windows start on different dates, so they are not an exact match.
CNBC also gave context for the 2024 price. Bitcoin passed $52,000 for the first time since November 2021. In November 2022 it traded at less than a third of that level, after losing more than 75% of its price following the collapse of FTX.
CNBC said the rise was largely tied to the ETF launch. The approval made it easier to buy Bitcoin on regulated stock exchanges. The total value of all Bitcoin passed $1 trillion for the first time since 2021.
Price Swings and Drawdowns
Bitcoin’s gains came with sharp falls. Using Bitbo’s January prices, the price dropped from $13,444.88 in January 2018 to $7,189.94 in January 2020, a fall of about 46.5%. From January 2021 to January 2023 it fell from $29,388.94 to $16,613.87, or about 43.5%.
The price then rose about 166% to $44,161.95 by January 2024. These are January snapshots, so they understate the full peak-to-low drops. These percentages were calculated for this article.
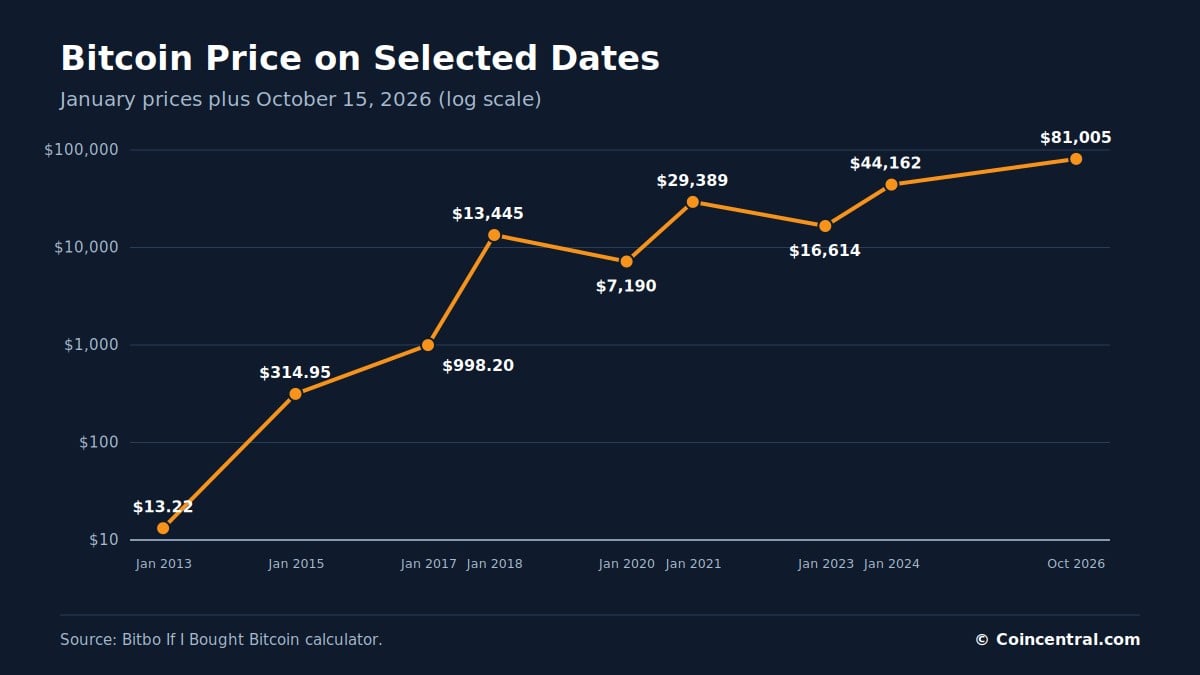
Figure 5: Bitcoin’s price on selected dates from January 2013 to October 2026, shown on a log scale.
Other sources describe deeper falls. CNBC says Bitcoin peaked near $69,000 in November 2021, then lost more than 75% after FTX failed. Pocket Option lists about $69,000 for 2021 and about $16,000 for 2022.
The Motley Fool says Bitcoin had drawdowns of more than 70% over the decade, and that most investors sold during them. BitradeX says the price fell from above $120,000 to below $60,000 between October 2025 and June 2026. That is a drop of at least half.
Table 6: Selected price events
Date
Event
Source
Nov 2021
Price peaks near $69,000
CNBC Make It
Nov 2022
Price falls more than 75% after FTX collapse
CNBC Make It
2022
Price near $16,000
Pocket Option
Jan 11, 2024
Spot Bitcoin ETFs launch
CNBC Make It
Oct 2025
Price above $120,000
BitradeX
Early Jun 2026
Price below $60,000
BitradeX
Oct 15, 2026
Price at $81,005
Bitbo
Table 7: January-to-January changes (calculated from Bitbo prices)
Period
Start price
End price
Change
Jan 2018 to Jan 2020
$13,444.88
$7,189.94
-46.5%
Jan 2021 to Jan 2023
$29,388.94
$16,613.87
-43.5%
Jan 2023 to Jan 2024
$16,613.87
$44,161.95
+165.8%
Pocket Option names four drivers of volatility. They are market mood and media, economic data such as inflation and interest rates, crypto rules and technology, and large holder moves and trading volume. It also lists halvings in 2012, 2016, 2020 and 2024, China’s mining ban in 2021 and the 2024 spot ETF approvals as past events.
The sources do not always agree on prices. Pocket Option lists Bitcoin at about $100 in 2013, while Bitbo shows $13.22 in January 2013. Pocket Option shows less than $0.01 for 2010, while Bitbo shows $0.06 in July 2010.
Pocket Option also says Bitcoin traded near $65,000 in June 2025. The page was last edited on August 7, 2025, so its price levels are dated. Readers should not use its $65,000 base for current math.
Entry Price and the Math Behind $1,000
BitradeX offers a simple formula. Future value equals $1,000 divided by your entry price, multiplied by Bitcoin’s price in 10 years. The percentage move matters more than the headline price.
At today’s Bitbo price of $81,005, $1,000 buys about 0.0123 BTC. This was calculated for this article. If Bitcoin doubles from that level, the position is worth about $2,000 before fees and taxes.
The next table shows BitradeX’s sensitivity check. A 75% fall leaves $250 and a 50% fall leaves $500. A fivefold rise gives $5,000 and a tenfold rise gives $10,000.
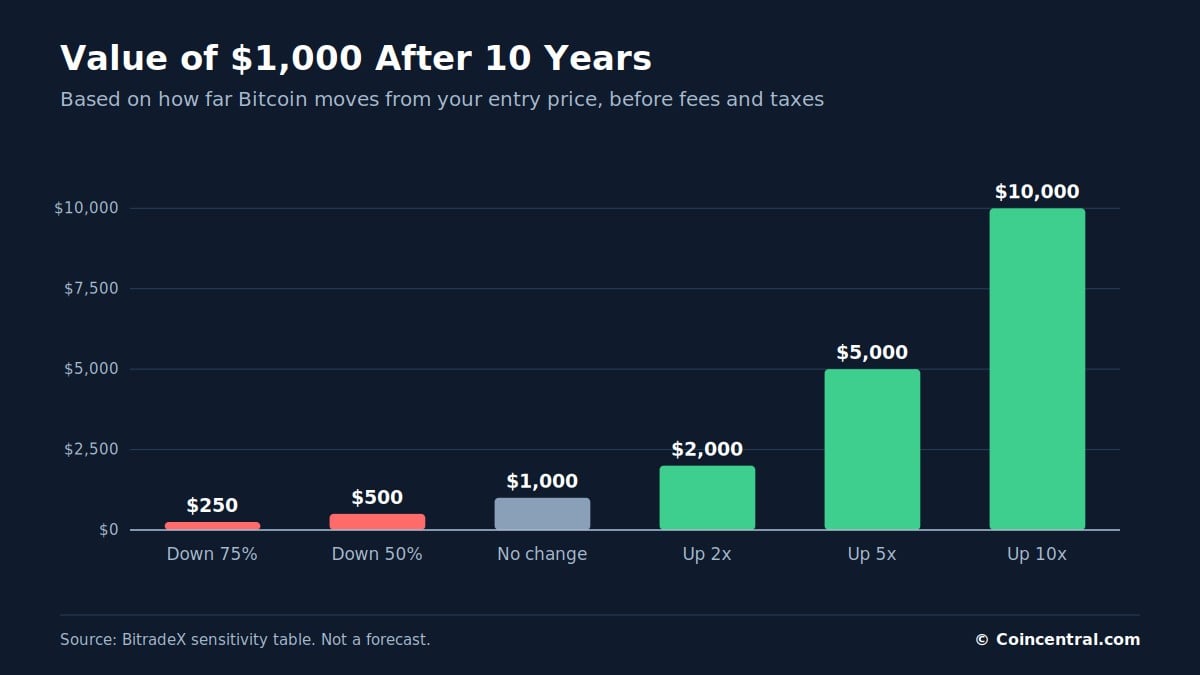
Figure 6: Value of a $1,000 Bitcoin purchase after 10 years under six price scenarios, before fees and taxes.
Table 8: Value of a $1,000 purchase by price change (BitradeX)
Price in 10 years vs. entry
Approximate value
Down 75%
$250
Down 50%
$500
No change
$1,000
Up 2x
$2,000
Up 5x
$5,000
Up 10x
$10,000
Entry price changes the result for any future price, and BitradeX tests three entries: $50,000, $100,000 and $150,000. A buyer at $50,000 who sells at $250,000 gets $5,000. A buyer at $150,000 who sells at the same price gets $1,667.
Table 9: Value of $1,000 by entry price and exit price (BitradeX)
Entry price
BTC bought
Exit $25,000
Exit $100,000
Exit $250,000
Exit $500,000
Exit $1,000,000
$50,000
0.020000
$500
$2,000
$5,000
$10,000
$20,000
$100,000
0.010000
$250
$1,000
$2,500
$5,000
$10,000
$150,000
0.006667
$167
$667
$1,667
$3,333
$6,667
Costs also change the final number. BitradeX lists trading fees and spreads, taxes, custody mistakes, panic selling and overtrading. Each can shrink a gain or turn a long hold into a short-term loss.
Table 10: Factors that change the final value (BitradeX)
Factor
Why it matters
Trading fees and spreads
They reduce the Bitcoin bought or the cash value when selling.
Taxes
Treatment depends on the country, holding period and type of sale.
Custody mistakes
Lost passwords or weak security can lock up a gain.
Panic selling
Selling in a deep drop turns a 10-year plan into a short-term result.
Overtrading
Frequent trades add costs that a buy-and-hold table ignores.
BitradeX says a 10-year holder may face several drops of 30%, 50% or more. It also says the money should not be needed for rent, debt or emergencies. Those points are about behavior, not math.
Forecasts and How to Read Them
Pocket Option published price scenarios based on a $65,000 starting price. For 2025, it showed $40,000, $75,000, $100,000 and $150,000, worth about $615, $1,154, $1,538 and $2,308 per $1,000. For 2030, it showed $150,000, $250,000 and $500,000, worth about $2,308, $3,846 and $7,692.
Bitcoin now trades above that $65,000 base, so the dollar values are out of date. Using Bitbo’s price of $81,005, a $150,000 price would turn $1,000 into about $1,852, $250,000 into $3,086, and $500,000 into $6,172. These were calculated for this article.
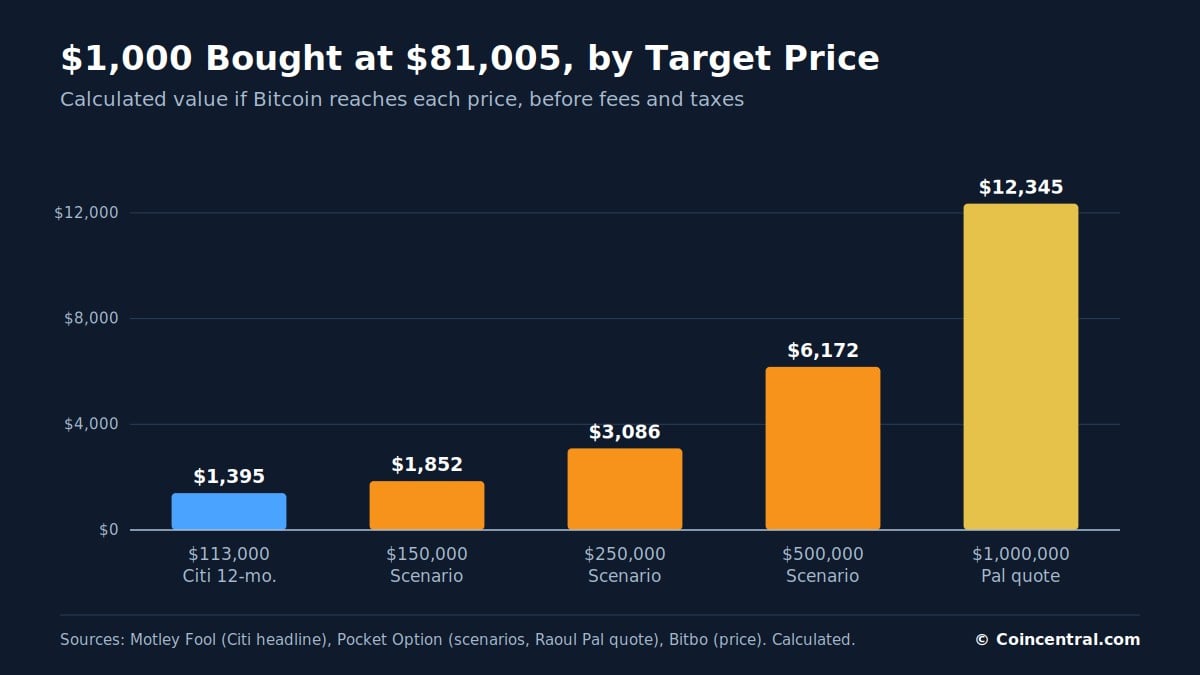
Figure 7: Value of $1,000 bought at $81,005 if Bitcoin reaches five different target prices.
Table 11: Value of $1,000 bought at $81,005, by target price (calculated)
Target price
Value of $1,000
Where the target comes from
$113,000
About $1,395
Citigroup 12-month target, per a Motley Fool headline
$150,000
About $1,852
Pocket Option 2030 scenario
$250,000
About $3,086
Pocket Option 2030 scenario
$500,000
About $6,172
Pocket Option 2030 scenario
$1,000,000
About $12,345
Raoul Pal quote, via Pocket Option
Pocket Option also quotes macro investor Raoul Pal, who said a $1 million price by 2030 is not unrealistic if crypto reaches mass adoption. At $1 million, a $1,000 purchase at today’s price would be worth about $12,345. The page gives no model behind the quote.
A Motley Fool headline from October 15, 2026 says Citigroup raised its 12-month Bitcoin price target to $113,000. That target would turn $1,000 at today’s price into about $1,395. Only the headline was available for this article.
Planners urge limits. CFP Chris Diodato told CNBC it makes sense for most people to hold 1% or 2% of a portfolio in crypto. He said he is hesitant to suggest more because Bitcoin is volatile and produces no cash flow.
BitradeX says no AI tool can know Bitcoin’s price in 10 years. Its advice is to write down the entry price, the amount bought, the reason for holding and the most you can afford to lose. The Motley Fool author also says past returns are unlikely to repeat.
Readers should note who published these sources. Pocket Option and BitradeX are trading platforms, and their pages promote their own services. The Motley Fool says it holds positions in and recommends Bitcoin.
In short, $1,000 invested in Bitcoin on September 3, 2016 grew to about $126,810 by the Motley Fool’s math. Buyers in later years saw smaller gains, and the data shows drops of 43% to more than 75%. No source can say what the next 10 years will bring.
This article is for information only. It is not financial, legal or tax advice.
Sources
The post How Much Could $1,000 Invested in Bitcoin Be Worth in 10 Years? appeared first on Blockonomi.