
Bitcoin3 min read
Bitcoin’deki Sert Düşüşün Nedeni Ne?
Bitcoin neden düşüyor sorusu, son haftalarda kripto yatırımcılarının en çok araştırdığı konular arasında yer alıyor. Bitcoin, eylül sonundaki 87 bin dolar seviyesinden gerileyerek 62 bin dola
How to Read a Forex Chart: A Beginner's Guide A forex chart shows how the price of a currency pair has changed over time. Price runs up the vertical axis on the right. Time runs along the bot
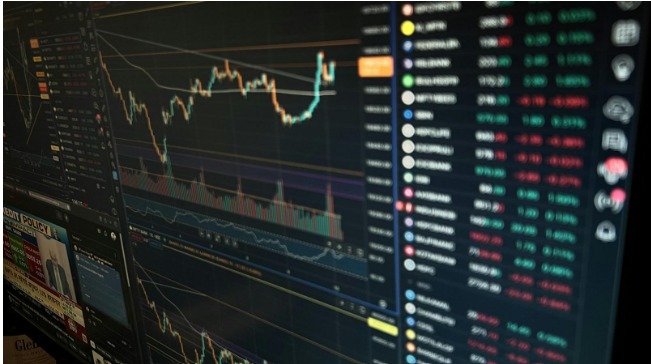
How to Read a Forex Chart: A Beginner's Guide
A forex chart shows how the price of a currency pair has changed over time. Price runs up the vertical axis on the right. Time runs along the bottom. Every shape on the screen is just a record of where buyers and sellers agreed to trade.
Charts look busy at first. Once you know what each mark means, you can read one in seconds.
Start with the label at the top. It tells you the pair, such as EUR/USD, and the timeframe, such as H1 for one hour.
The price on the chart is the value of the first currency in terms of the second. If EUR/USD reads 1.0850, one euro costs 1.0850 US dollars. When the line goes up, the euro is getting stronger against the dollar.
Every pair has two prices at any moment, a bid and an ask. A chart can be built on the bid, the ask or the midpoint between them. Check which one your platform uses, since it affects where your stops and orders seem to sit.
A line chart joins the closing prices of each period. It is clean and easy to read, and it shows the overall trend well. But it hides the highs and lows inside each period, so you cannot see how far price swung.
A bar chart shows four prices for each period: the open, high, low and close. Traders call this OHLC. The top of the bar is high and the bottom is low. A small tick on the left marks the open. A tick on the right marks the close.
Candlesticks show the same four prices as a bar, in a form that is easier to read at a glance. Many forex traders use them as their main view.
The method is often credited to Munehisa Homma, a rice trader in 18th century Japan. It reached Western traders much later, through Steve Nison's 1991 book on Japanese candlestick charting.
Each candle has two parts.
The body is the thick part. It shows the range between the open and the close.
The wicks are the thin lines above and below. They show the highest and lowest prices reached.
The color tells you direction. On most platforms, a green or white candle closed higher than it opened. A red or black candle closed lower. You can change these colors in your settings.
Here is an example. On a one hour chart, a green candle opens at 1.0850 and closes at 1.0870. Its top wick reaches 1.0880 and its bottom wick dips to 1.0845. In that hour, buyers won, but sellers pushed the price back down from the high before the close.
Long wicks matter. A long upper wick shows that price was pushed back from higher levels. A small body with long wicks on both sides shows a tug of war with no clear winner.
Each candle covers one period. On a daily chart, one candle is one day. On a five minute chart, one candle is five minutes. Common choices include:
M1, M5 and M15 for very short trades
H1 and H4 for trades that last hours to days
D1 and W1 for the bigger picture
The same move can look very different across timeframes. A sharp drop on a five minute chart may be a tiny dip inside a strong uptrend on the daily.
That is why many traders start on a higher timeframe to find the trend, then drop to a lower one to time the entry. Rule based evaluations reward this habit. In a 1 step challenge prop firm setup, there is a single phase with fixed loss limits, so trades taken against the bigger trend can use up your room fast.
Do not reach for indicators straight away. Read the price itself.
Trend: higher highs and higher lows mean an uptrend. Lower highs and lower lows mean a downtrend.
Range: if price keeps bouncing between two levels, the market is moving sideways.
Support and resistance: these are levels where price has turned more than once. They often act as floors and ceilings.
Forex has no central exchange, so no one sees the full traded volume. The volume bars on most platforms show tick volume, which counts how often price changes. It is a rough guide to activity, and it only reflects your own broker's feed.
Chart reading is a skill, and skills take reps. Open a daily chart of a major pair and mark the trend, the swing highs and lows, and the levels where price turned.
Then do it again on a lower timeframe. You can practice on a demo account or a Free Funded Account trial before you put real money at risk.
After a few weeks, the screen stops looking like noise. You start to see the story of each session in the shape of the candles.
For More - https://www.coingabbar.com/