With the rally pausing, the former resistance zone around $77 now sits at the center of the chart as the pivotal line for buyers. Higher Highs, Tired Momentum HYPE pushed up to $83 before ret
With the rally pausing, the former resistance zone around $77 now sits at the center of the chart as the pivotal line for buyers.
Higher Highs, Tired Momentum
HYPE pushed up to $83 before retreating toward its previous range. The price move pushed past old records, but the weekly Relative Strength Index (RSI) printed a lower peak than it did during the prior rally.
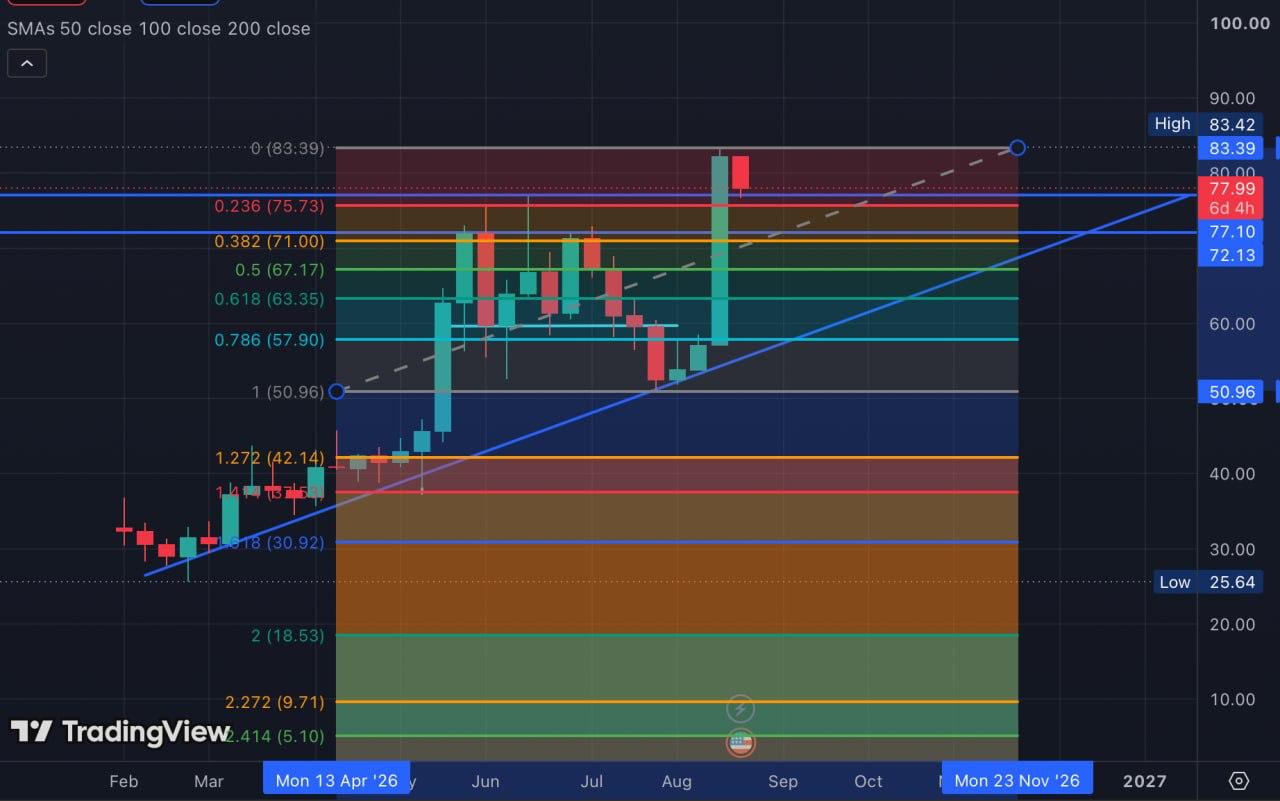
Hyperliquid weekly price chart highlighting recent bullish momentum and key resistance levels.
This dynamic forms a classic weekly momentum divergence: price creates a higher peak while the momentum indicator settles at a lower one. Divergence alone does not guarantee a sudden market crash or offer an exact target for short positions. Instead, it indicates that the latest surge carried less aggressive buying volume than the run that created the previous RSI peak.
Technical warnings require price validation before they change the broader trend. For HYPE, that confirmation depends on whether buyers can hold the ground they reclaimed during the recent surge.
The $77 Support Test
The previous record area between $77 and $78 acted as HYPE’s long-term resistance ceiling. After breaking out toward $83, the market returned to test that same area from above to confirm it as new support.
Brief intraday wicks below $77 on shorter timeframes carry little weight here, as weekly candle closes provide the necessary signal to filter out short-term noise. A weekly close below $77-$78 would indicate that buyers failed to defend the breakout area, opening the path for a deeper move downward. Conversely, maintaining price above $77 keeps the primary uptrend intact despite the softer weekly RSI reading.
Our team already marked $77 as the central level buyers need to defend during this run. The weekly RSI divergence increases the technical importance of that price zone rather than creating a separate thesis on its own.
Key Support Levels Below $77
If price breaks beneath $77 on a weekly close, the chart points toward a key support cluster between $71 and $72. This level features technical confluence, bringing together the 0.382 Fibonacci retracement near $71 and an ascending weekly trendline that has supported HYPE’s advance for months.
A slide into the $71-$72 zone represents a normal correction inside a larger rally rather than an immediate structural breakdown. However, losing both the $77 breakout floor and the trendline confluence underneath would provide clearer technical evidence that the weekly momentum divergence is resolving into a multi-week retracement.
If that confluence fails, lower Fibonacci retracement levels rest at $67 (the 0.5 Fib) and $63 (the 0.618 Fib). These figures represent logical support zones to monitor on the chart if primary support gives way.
READ MORE:
 Hyperliquid’s $1.2B Fee Engine Puts HYPE in Focus
Protocol Fundamentals Offer a Cushion
While the technical charts signal caution, Hyperliquid’s core network metrics remain strong. As we earlier reported the platform generated roughly $6.2 million in protocol fees on Aug. 23. A designated portion of those platform fees flows directly into the Assistance Fund, which purchases HYPE tokens from the open market.
Automated market purchases won’t halt a market-wide sell-off, though steady protocol buybacks build a structural floor that purely speculative coins don’t have. Active trading volume continues to fuel recurring, protocol-driven demand for the token alongside general market trading.
What Confirms the Next Trend Move
The technical breakdown scenario requires explicit price confirmation. A weekly close below $77–$78 shifts primary focus down to the $71-$72 support zone. Losing that trendline confluence would subsequently bring the lower $67 and $63 Fibonacci levels into view.
The invalidation path for the bearish warning remains straightforward. If buyers defend $77 as support and push a weekly close back above $83, the momentum divergence loses its technical relevance. Such a move would re-enter the chart into price discovery, forcing traders to re-evaluate momentum at higher price levels.
At the time of writing, the chart shows neither a confirmed breakdown nor a clear trend extension – it remains a test of whether market demand can defend a former breakout level while weekly momentum slows down.
This article is provided for informational purposes only and does not constitute investment advice.
The post HYPE Flashes Warning Sign on Weekly Chart as Momentum Lags appeared first on Coindoo.