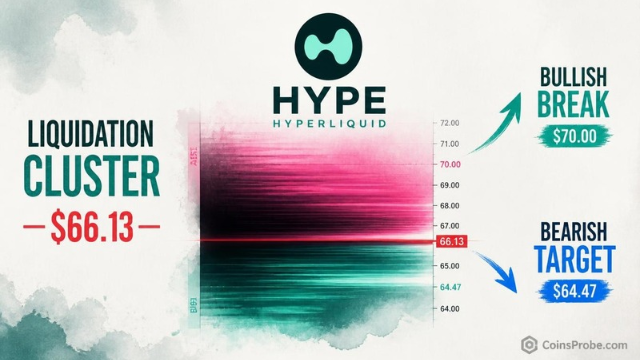
Key Highlights HYPE perpetual trades at $66.13 — directly on a major liquidation cluster per Alphractal's heatmap analysis Dense ask-side pressure above ~$70 and bid-side depth below ~$65 cre
Key Highlights
HYPE perpetual trades at $66.13 — directly on a major liquidation cluster per Alphractal's heatmap analysis
Dense ask-side pressure above ~$70 and bid-side depth below ~$65 creates a compression zone with amplified breakout potential
$64.47 is the labeled next liquidation concentration below current price — first downside target if $65 breaks
Hyperliquid’s native token HYPE is trading at approximately $66.13 on its perpetual contract — and the positioning data suggests the market is at an inflection point. The token is sitting directly on one of the densest liquidation clusters visible on the 1-hour chart, a configuration that historically precedes sharp, fast directional moves rather than prolonged consolidation.
An analyst at Alphractal — a crypto market intelligence platform — flagged this setup with a visual teaser on the liquidation heatmap, noting the native Hyperliquid perpetual as the focus. The post offered no explicit directional call, which is itself meaningful: when a liquidation heatmap analyst presents a chart without a bias, the data is non-directional by design. The setup here is about compression, not conviction.
A liquidation heatmap is a non-directional tool. It does not predict price direction. It maps where leveraged positions — both long and short — will be forcibly closed if price reaches certain levels. Dense horizontal clusters on the heatmap represent zones where a large number of liquidation orders are stacked. When price enters one of these zones, the resulting cascade of forced closures amplifies the move in whichever direction it is traveling.
The 1-hour HYPE perpetual chart on Hyperliquid currently shows a dense horizontal liquidation cluster centered directly at the $66.13 level — precisely where price is trading at the time of writing. The order book structure reinforces this reading: heavy ask-side pressure (shown in pink on the heatmap) sits above approximately $70, while significant bid-side depth (teal) anchors below $65. Price is pinned between these two walls.
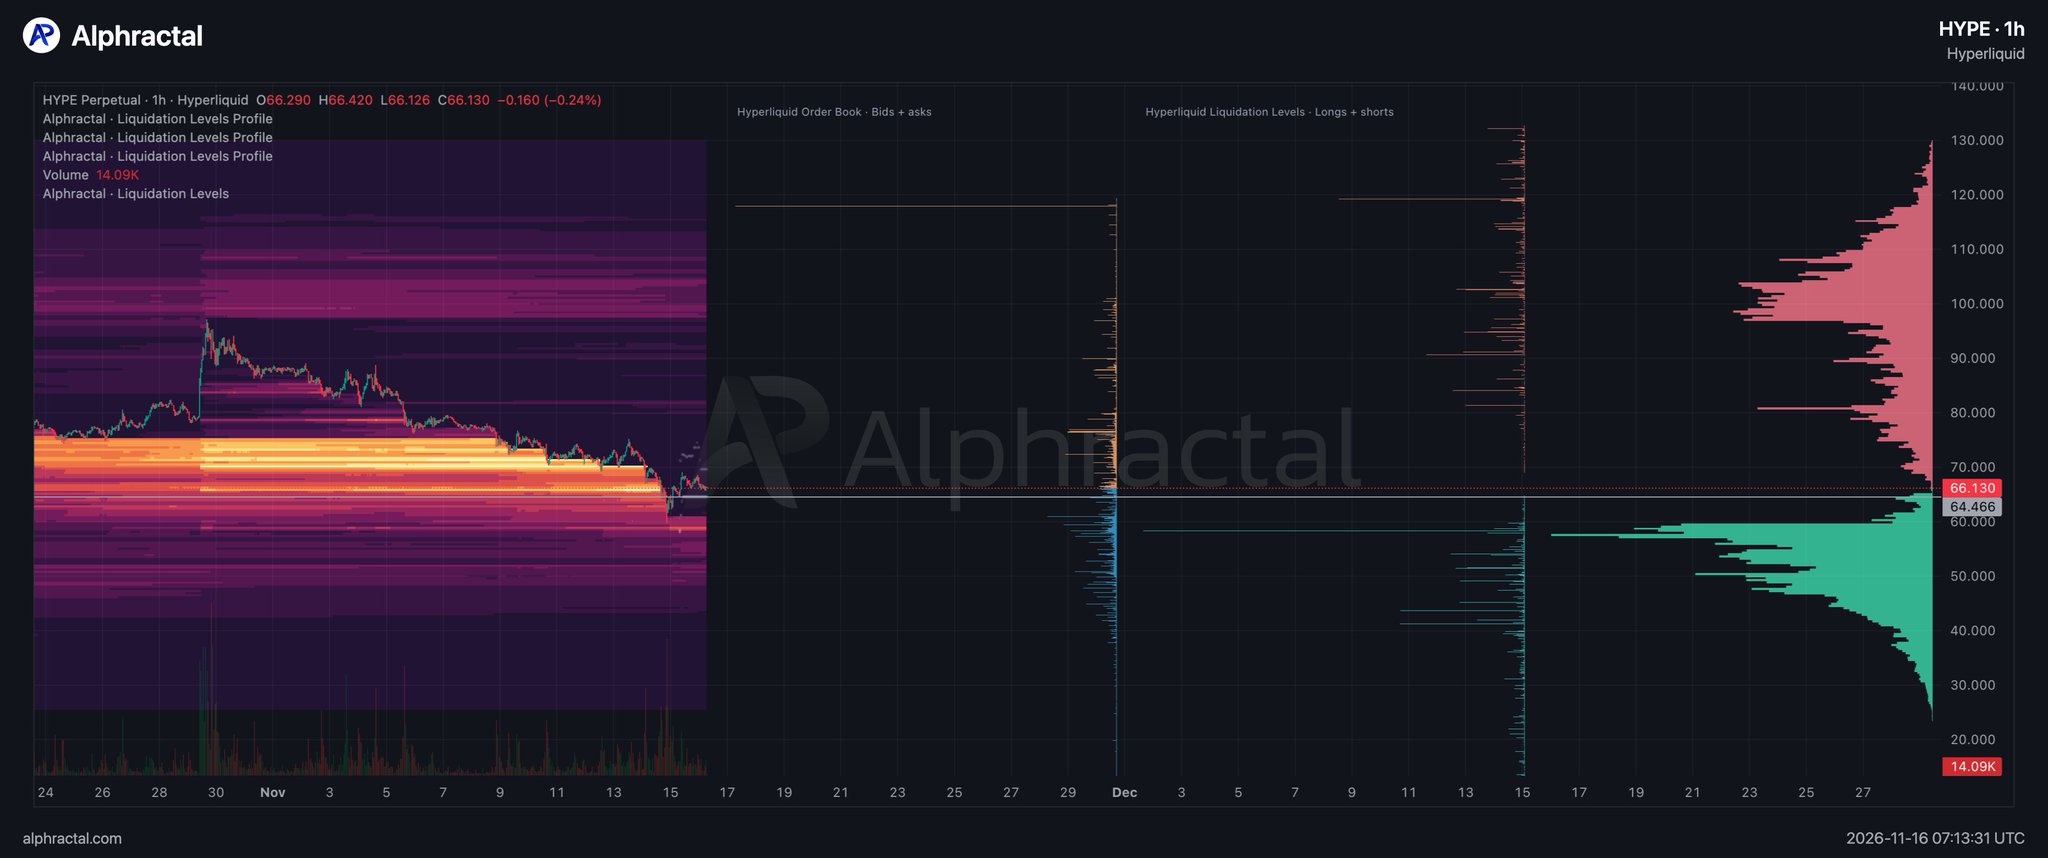
HYPE/USD — 1H Perpetual (Hyperliquid) | Source: @Alphractal (X)
The red horizontal line at $66.13 on the chart is not a support or resistance level in the traditional technical sense. It is a liquidation concentration zone — a price coordinate where the aggregate open interest in leveraged positions reaches a local maximum. The chart’s labeled high and low for the current candle are $66.420 and $66.126 respectively, confirming that price has been compressing in an extremely tight 29-cent range.
That compression matters. When price oscillates within a narrow band directly on top of a liquidation cluster, it creates a feedback dynamic: neither bulls nor bears are being flushed out yet, which means the energy from both sides is accumulating. The right-axis scale on the chart extends from $14.09K at the low end up through $140,000 at the high end, indicating this is a macro-scale heatmap — the liquidation cluster at $66 is visible even on that broad canvas, which signals its significance. Volume at the time of the analysis read 14.09K contracts.
It is worth noting that the broader altcoin market has been navigating its own structural pressures. As covered previously, TOTAL3 lost the 200-Week MA with analysts warning of capitulation ahead — a macro backdrop that adds weight to any compression setup in an individual altcoin perpetual.
Because the liquidation heatmap is explicitly non-directional, the analysis splits cleanly into two paths determined entirely by which side capitulates first.
If price breaks above ~$70: The ask-side liquidation wall above current price becomes fuel. Short positions leveraged in that zone get forcibly closed, generating automatic buy orders that accelerate the move upward. The heatmap suggests the ask-side concentration is thinner above $70 than the bid-side concentration below $65, meaning an upside break could travel faster once it clears that level.
If price breaks below ~$65: The bid-side liquidation cluster at $64.47 — labeled on the chart’s right axis — becomes the first target. Long positions leveraged in that range get forcibly closed, generating automatic sell orders. The $64.47 level marked on the chart represents the next meaningful liquidation concentration below current price.
The macro context from DXY adds an external variable: a strengthening dollar at multi-year highs historically compresses risk asset upside, which could bias the resolution downward — though the heatmap itself carries no such directional assumption.
HYPE’s perpetual is coiled at $66.13 — directly on a major liquidation cluster, compressed between $65 bid-side depth and $70 ask-side resistance, with volume at 14.09K contracts and a 29-cent high-to-low range on the most recent candle. The heatmap does not say which way. It says the move, when it comes, will be amplified.
Watch $70 for a bullish resolution and $64.47 for the first meaningful downside liquidation target. Whichever level breaks first with sustained volume will determine the near-term structure for HYPE perpetual traders.
Disclaimer: The views and analysis presented in this article are for informational purposes only and reflect the author’s perspective, not financial advice. Technical patterns and indicators discussed are subject to market volatility and may or may not yield the anticipated results. Investors are advised to exercise caution, conduct independent research, and make decisions aligned with their individual risk tolerance.
Read Also: Aster CEO Blames Malicious Liquidations After ASTER Surges 30% Then Crashes 32%