Hyperliquid price prediction August 2026 is drawing fresh attention as HYPE circles back to a level that has decided its last two major moves. This is the same zone that flipped both the dail
Hyperliquid price prediction August 2026 is drawing fresh attention as HYPE circles back to a level that has decided its last two major moves.
This is the same zone that flipped both the daily and weekly charts before, and price is testing it again right as August gets underway.
Whether HYPE confirms strength here or breaks down could set the tone for the rest of the month.
HYPE Market Snapshot
Metric
Value
Price
$55.42
24h Change
-0.23% (-$0.1277)
Market Cap
$14.01B
Futures Volume (24h)
$1.88B
Spot Volume (24h)
$111.27M
Open Interest
$2.31B
Circulating Supply
252.59M HYPE
Total Supply
952.98M HYPE
Max Supply
952.98M HYPE
Data from the HYPE/USDT daily and weekly charts on Binance via TradingView and the Hyperliquid market page on CoinGlass were captured on July 29, 2026, around 12:25 PM IST.
Recheck live figures close to publish time since price and open interest shift fast.
HYPE Spot ETF and Latest News
Beyond the chart, this Hyperliquid price prediction is also shaped by a few fundamental threads worth tracking through August.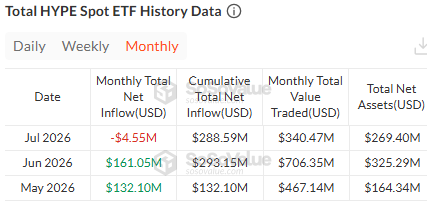
As per SoSoValue ETF data, HYPE spot ETFs recorded a net outflow of $4.55M in July 2026, the first monthly outflow after two strong months, though cumulative net inflows still stand at $288.59M.
That follows $161.05M in net inflows during June and $132.10M in May, with total net assets easing to $269.40M in July from $325.29M the month before as monthly trading value also cooled to $340.47M.
As per a recent post from MSB Intel, Hyperliquid's all-time token burn has now reached 47.27M HYPE, equal to 4.73% of its 1B max supply, adding a steady deflationary backdrop to this $HYPE price forecast.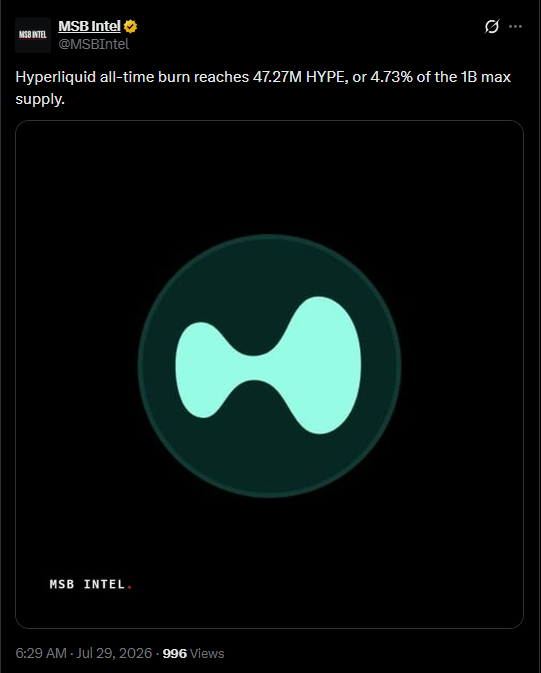
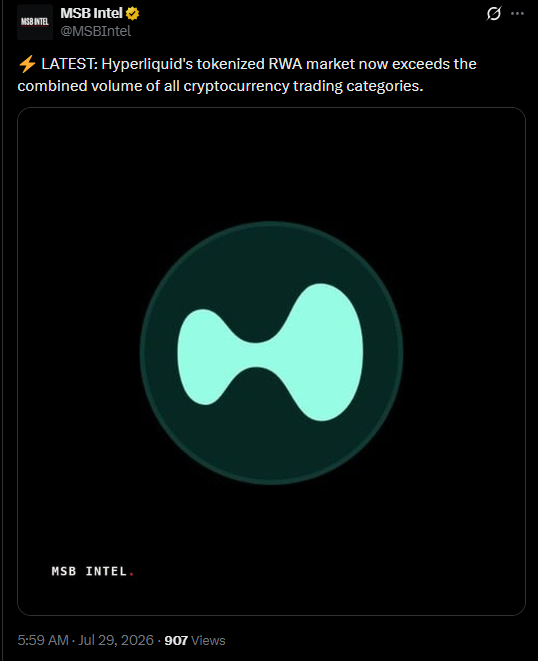
The same account also flagged that Hyperliquid's tokenized RWA market has now overtaken the combined trading volume of every other cryptocurrency category, a sign of how quickly the platform's real-world asset rails are scaling.
Quick Take
HYPE is trading near $55.42, sitting right back at the trendline and flip area that fueled its last major rally
Daily bullish trigger: support holding here opens room toward $60.426, $63.454, and $69.062
Daily bearish trigger: a confirmed close below $52.481 shifts focus to $50.010, with a close below $50 invalidating the buying view
Weekly setup: price is retesting the same flip zone and trendline that sparked the last rally, with a double bottom forming that needs a rejection candle to confirm
This is a multi-timeframe read, so recheck these areas if price closes well beyond this range
HYPE Daily Chart Analysis
On the daily timeframe, HYPE has been following an ascending trendline that has held price up through most of this cycle.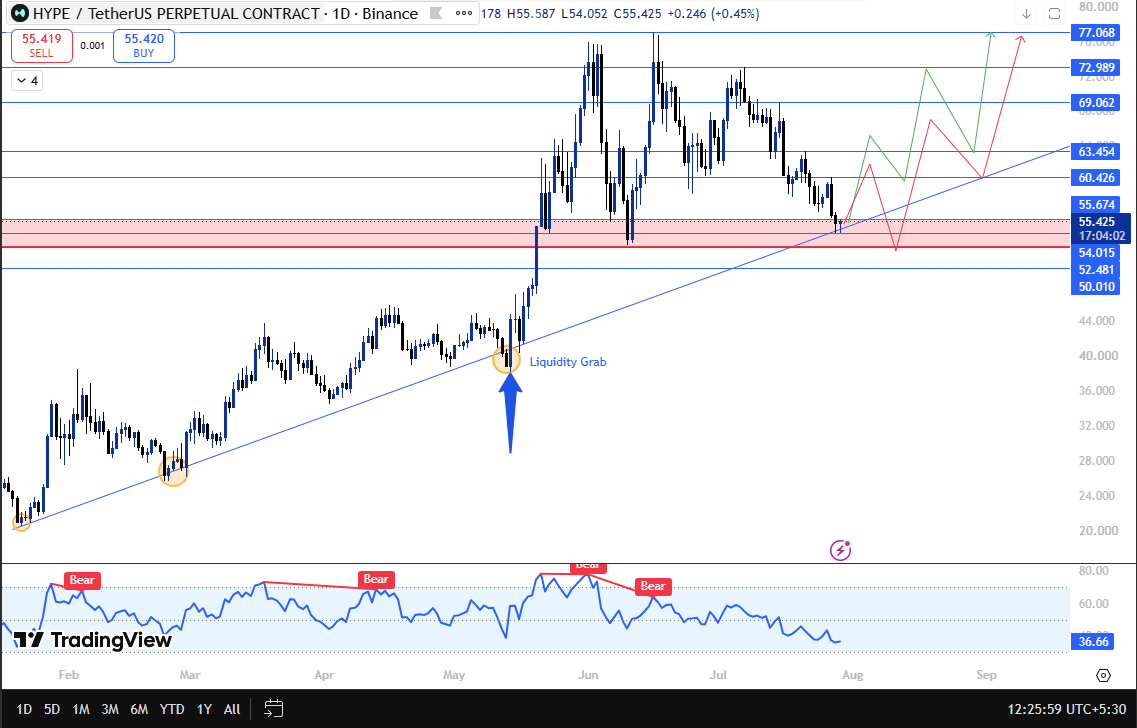
After some early struggle, a second tap of that trendline produced a higher high.
Right after that tap, the price broke below the trendline and even closed under it on the daily chart, but that move turned out to be a liquidity grab rather than a genuine breakdown.
Nearly a full week's worth of selling got absorbed in that single session, and what followed was a sharp breakout that carried HYPE to a fresh all-time high.
Price has now pulled back to retest that very same trendline.
If HYPE holds support here, the next resistance levels line up at $60.426, $63.454, and $69.062. with room to stretch even higher if momentum builds.
If instead the price breaks down and closes below $52.481, the flip zone that has acted as the last line of support, the next level to watch is $50.010, a psychological number and a heavier support zone.
A confirmed close below $50 would invalidate the buying view entirely.
HYPE Weekly Chart Analysis
On the weekly chart, HYPE previously took support from this exact same flip zone before rallying all the way to its all-time high, and price has now backed up to that identical zone, with the ascending trendline adding further support underneath it.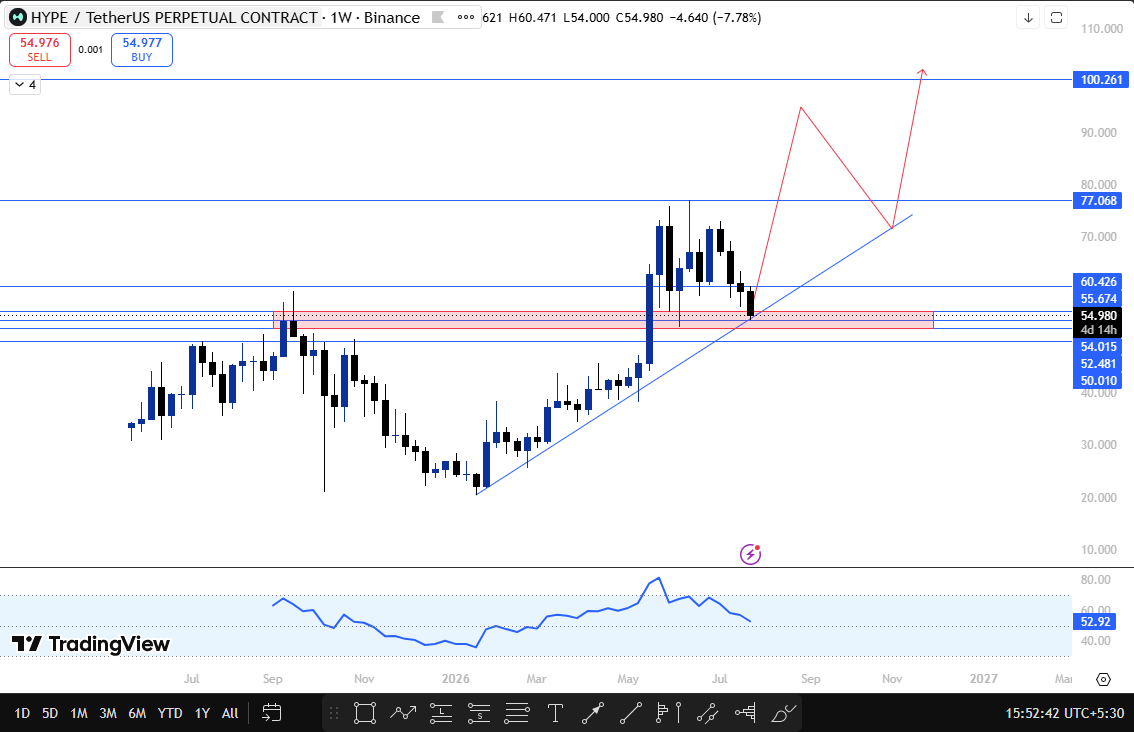
If price reverses from here, it would complete a double bottom, and that structure is actively forming right now.
Confirmation only comes once a rejection candle closes back above the zone on a weekly basis.
From there, the weekly targets line up first at $77.068, with $100.261 as the extended stretch target if momentum carries through beyond that level.
HYPE Support And Resistance Levels
Timeframe
Trigger
Resistance Targets
Breakdown Trigger
Support Targets
Daily
Support holds at trendline and flip zone
$60.426, $63.454, $69.062.
Close to $52.481
$50.010
Weekly
The rejection candle closes back above flip zone
$77.068, $100.261
Close below flip zone and trendline
$50.010
Risk-Reward Table
Case
Trigger
May Aim For
Bull Case (Daily)
Support holds at the trendline and flip zone
$60.426 toward $69.062 and higher
Bear Case (Daily)
Close to $52.481
$50.010
Bull Case (Weekly)
Rejection and close above flip zone confirms double bottom
$77.068 toward $100.261
Bear Case (Weekly)
Close below $50
The buying view is invalidated
Invalidation: This setup holds only as long as HYPE keeps closing above $52.481 on the daily chart.
A confirmed close below that undoes the trendline support thesis and shifts focus toward $50.010, with a close under $50 invalidating the broader buying view.
On the weekly, the double bottom only confirms once a rejection candle closes back above the flip zone, after which the upside targets shift to $77.068 first, then $100.261 if momentum carries through.
Expert View
Traders following this Hyperliquid price prediction seem more focused on structure than on the single month of ETF outflows, and that tracks given cumulative inflows are still comfortably positive, and the burn rate keeps chipping away at supply.
A retest of the same flip zone that launched the last rally, now lining up with a possible double bottom on the weekly chart, is the kind of setup that tends to get watched closely rather than dismissed.
Confirmation still depends on $52.481 holding on the daily and a clean rejection candle on the weekly before either target range becomes the base case.
Disclaimer
This article is for informational purposes only and does not constitute financial advice
Cryptocurrency markets are highly volatile. Please verify current data independently and consult a licensed financial advisor before making any investment decisions.