Hyperliquid has been one of the more technically clean setups in the altcoin market lately, and the current price action is giving traders plenty to work with. After a sharp correction that t
Hyperliquid has been one of the more technically clean setups in the altcoin market lately, and the current price action is giving traders plenty to work with. After a sharp correction that tested buyer conviction, HYPE is now bouncing from a significant demand zone, and the next target sitting at $77 is drawing serious attention from both retail and institutional participants.
The Ascending Triangle That Started It All
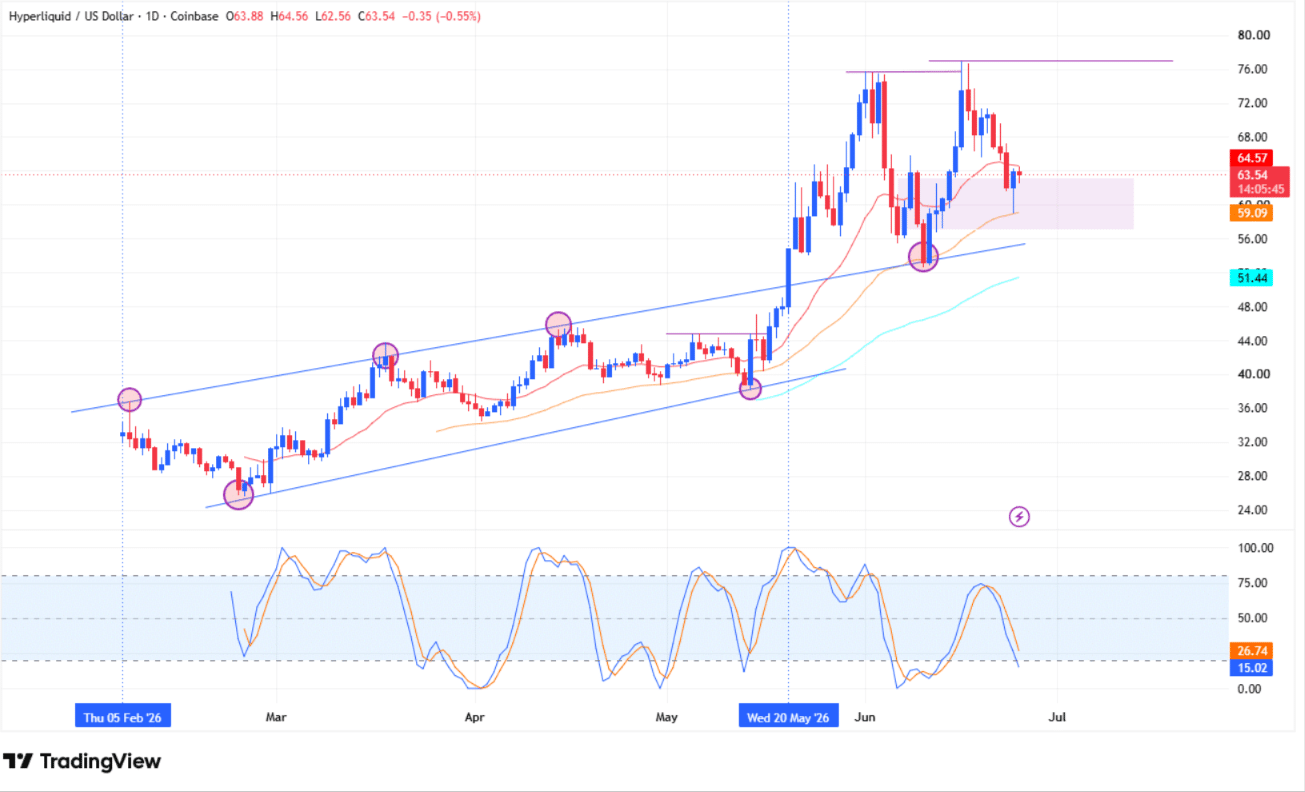
Since its debut on a major U.S. cryptocurrency exchange back in early February, the Hyperliquid price prediction has largely centered on one dominant pattern: an ascending triangle. This is a bullish continuation formation where price makes a series of higher lows while bumping up against a flat resistance ceiling, typically a signal that buyers are slowly overpowering sellers with each successive push.
HYPE did exactly what the textbook suggests. It broke out of that triangle on May 20 and surged aggressively toward $75, a move that turned heads across crypto trading communities. However, as tends to happen with explosive breakouts, the follow-through ran into a wall of overhead supply, and the price reversed sharply. That pullback dragged HYPE back toward the triangle’s upper boundary near $53, which held as support and sparked another recovery leg.
Between $57 and $63, the rapid sell-off left behind what analysts call a market imbalance, a price gap where very little trading occurred, leaving unfilled orders on both sides. These zones have a way of pulling price back for a retest, and that is precisely where HYPE is trading at the time of this report.
Why the $77 Hyperliquid Price Target Is Not Arbitrary
When traders talk about price targets, the best ones are not pulled from thin air as they are anchored in real data, and the $77 level checks several boxes that make it worth watching closely.
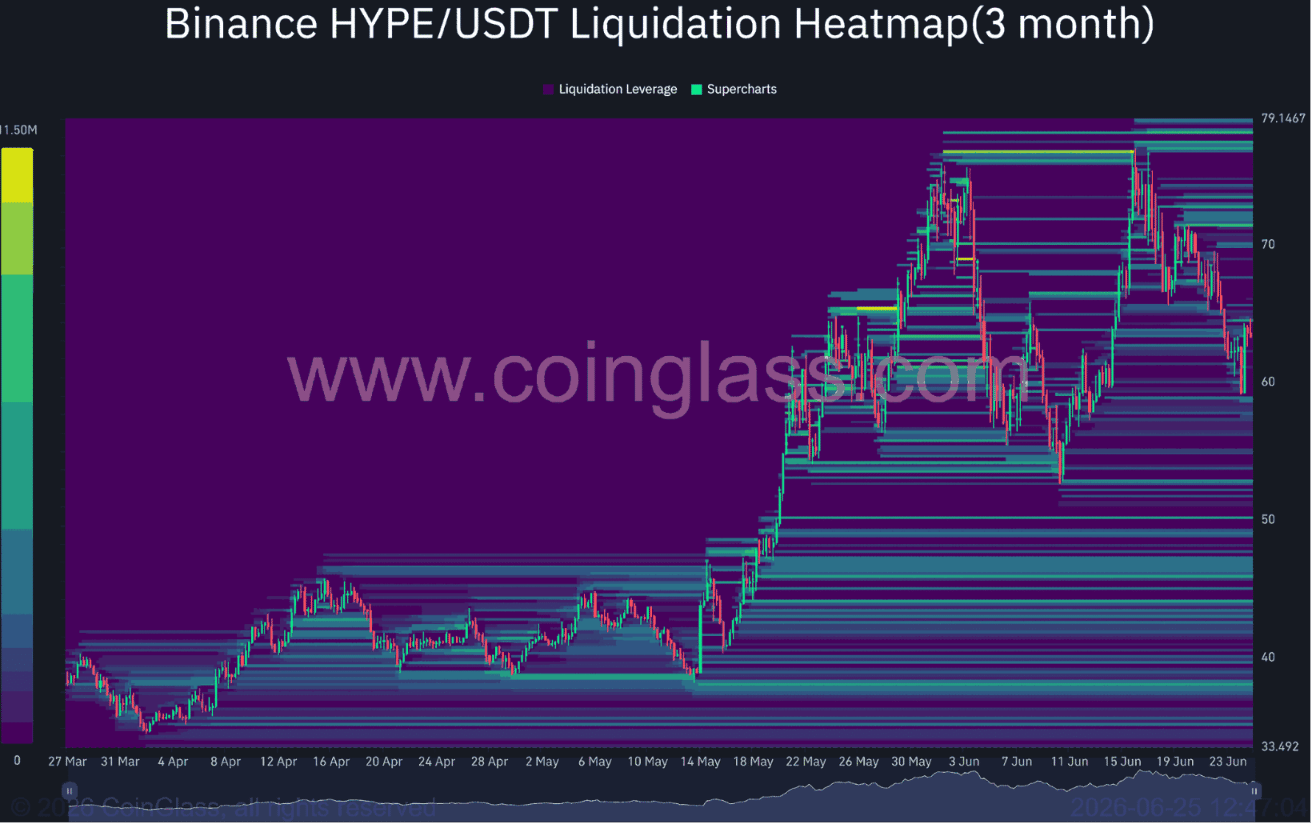
According to liquidation heatmap data from a leading derivatives analytics platform, approximately $10 million worth of liquidity clusters are stacked near the $77 resistance zone. In crypto derivatives markets, these clusters represent areas where a high concentration of leveraged positions would be forcibly closed if price reaches that level. Think of it like a gravity well: price tends to drift toward where the most orders are waiting, because clearing those positions generates the volume needed for the next move.
The Hyperliquid price prediction pointing to $77 is therefore grounded in real market mechanics, not just chart aesthetics. Buyers and sellers alike are watching the same level, which reinforces it as a legitimate battleground.
Trading Volume Surge Tells Its Own Tale
One of the most reliable confirmation signals in technical analysis is volume, and HYPE is delivering on that front. Over the four trading days leading into this report, network-level trading volume on Hyperliquid climbed sharply, suggesting that participants were not just watching from the sidelines but actively building long positions in anticipation of a move higher.
Volume expansion during a recovery phase is a constructive sign. When a token bounces on thin volume, that rebound is suspect. When it bounces on rising volume, there is real conviction behind it, and that distinction matters enormously when evaluating whether a support zone will actually hold or just delay the next leg down.
Technical Indicators Align With the Bullish Case
Beyond the volume and liquidity data, the on-chart indicators are leaning in the same direction. HYPE is currently trading above its key Exponential Moving Averages, which function as dynamic support levels and tend to reflect the broader directional bias of a token’s trend. Trading above these averages signals that the medium-term structure remains intact.
The stochastic RSI, a momentum oscillator that measures whether a token is overbought or oversold relative to its recent price history, has just bounced from oversold territory. This timing aligns almost perfectly with the price touching the $57 to $63 imbalance zone, which adds credibility to the argument that this zone is acting as a genuine reversal point and not just a temporary resting spot.
For the Hyperliquid price prediction to remain valid, buyers need to defend this imbalance zone and convert it into confirmed support. If they do, the path to $77 looks open. If sellers regain control here, the next meaningful support sits back near the ascending triangle boundary around $53.
What Could Derail the Bullish Outlook
No technical setup plays out in a vacuum. Broader market conditions matter, and Bitcoin recently came under renewed selling pressure, which tends to drag altcoins lower regardless of their individual structure. A sustained BTC downturn could neutralize even the cleanest HYPE setup.
Additionally, once HYPE reaches $77, traders should expect resistance to be real and meaningful. That $10 million liquidity cluster is not just a magnet; it is also a zone where profit-taking will intensify and shorts may pile in expecting a rejection. A clean break above $77 on strong volume would be needed to sustain further upside toward new highs, otherwise a second rejection at that level could set the stage for a deeper correction.
Conclusion
The Hyperliquid price prediction narrative heading into late June 2026 is genuinely constructive, with HYPE holding a key imbalance zone, volume rising in support of the move, and both EMAs and stochastic RSI confirming bullish bias. The $77 resistance zone, backed by $10 million in liquidity clusters, is the make-or-break level that will define the token’s next major directional move. Traders who understand the mechanics behind that level will be better positioned to navigate whatever comes next.
Frequently Asked Questions
What is the current Hyperliquid price target? The near-term Hyperliquid price prediction points to $77, where a significant $10 million liquidity cluster acts as a key resistance and potential price magnet.
What is a market imbalance in crypto trading? A market imbalance is a price range where trading occurred too quickly for orders to be properly filled on both sides, leaving an inefficiency that price often returns to retest.
What does the stochastic RSI indicate for HYPE? The stochastic RSI for HYPE has bounced from oversold territory, which signals that short-term selling pressure may be exhausted and a recovery move is likely underway.
Glossary of Key Terms
Ascending Triangle: A chart pattern formed by a flat upper resistance line and a rising lower trendline, typically indicating bullish momentum building beneath a key resistance level.
Market Imbalance: A price zone where rapid movement left a gap in two-sided trading activity, creating an area that price frequently revisits to fill unfilled orders.
Exponential Moving Average (EMA): A type of moving average that gives more weight to recent price data, commonly used to identify trend direction and dynamic support or resistance levels.
Stochastic RSI: A momentum indicator derived from the Relative Strength Index, used to identify overbought or oversold conditions within a given time period.
Sources
tradingview
coinglass
heyperliquid
Read More:Hyperliquid Price Prediction: Bulls Eye the $77 Resistance as HYPE Builds Momentum">Hyperliquid Price Prediction: Bulls Eye the $77 Resistance as HYPE Builds Momentum