Hyperliquid price prediction watchers have had a fairly patient few weeks with HYPE, and the chart right now tells a story of quiet resilience rather than panic. The coin has been sliding low
Hyperliquid price prediction watchers have had a fairly patient few weeks with HYPE, and the chart right now tells a story of quiet resilience rather than panic.
The coin has been sliding lower along a descending trendline since late July, yet the way it is sliding says more than the slide itself.
This piece is prepared using chart levels, CoinGlass data, and market news supplied directly for this breakdown. It is meant for general market understanding and is not financial advice. CoinGabbar and the analyst preparing this piece do not hold a position in HYPE at the time of publication.
The levels discussed below come from the 4-hour HYPE perpetual chart and reflect a short to medium-term view.
If the price closes meaningfully outside the ranges mentioned here, this Hyperliquid price prediction would need to be rechecked against the updated chart.
Hyperliquid (HYPE) Price Right Now
Metric
Value
Current Price (CMP)
$55.312
24-Hour Change
+2.16% (+$1.1699)
Market Cap
$13.99B
Futures Volume (24h)
$1.62B
Spot Volume (24h)
$76.61M
Open Interest
$2.29B
Circulating Supply
252.68M
Total Supply
952.71M
Max Supply
952.71M
Open interest is the total value of outstanding HYPE futures contracts that have not yet been closed or settled.
At $2.29B, open interest here is sizable relative to HYPE's market cap, which means leveraged positioning is playing an outsized role in how sharply price reacts around the levels discussed in this Hyperliquid technical analysis.
Chart source: TradingView, HYPE/USDT Perpetual Contract, Binance, 4 hour timeframe, captured 11 August 2026, 10:55 AM IST (05:25 AM UTC). Data source: CoinGlass, Hyperliquid market page, captured 11 August 2026, 10:55 AM IST.
Methodology and Data Sources
The technical structure in this HYPE price prediction comes from an independent reading of the Hyperliquid 4-hour perpetual chart on Binance, covering the descending trendline and the horizontal levels marked on it.
Market figures such as volume, open interest, and supply data are pulled from CoinGlass. Liquidation numbers are sourced from CoinGlass's liquidation tracker for HYPE.
ETF flow data and news context are credited to their original sources with timestamps wherever referenced.
HYPE Spot ETF and news
Fresh ETF data adds useful context to this Hyperliquid price forecast. Total HYPE spot ETF net assets stood at $265.47M as of 10 August 2026, up from $257.35M on 7 August.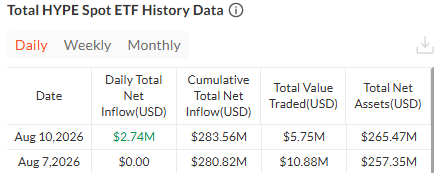
Daily net inflow on 10 August came in at $2.74M against $5.75M in traded value, while 7 August saw zero net inflow on $10.88M of turnover.
Cumulative net inflow since inception has climbed to $283.56M.
The steady, if modest, positive inflow trend during a period when price has been drifting lower is worth noting.
It suggests at least some structural demand is being absorbed even as the spot chart trades under pressure.
A separate account, Hyperliquid Daily, flagged on X that despite what it called regulatory FUD and institutional selling, some larger wallets have been quietly accumulating HYPE.
It noted that three newly created wallets withdrew roughly 165,425 HYPE, worth close to $9.16M, from the exchange FalconX over the past five days, even as some institutions and teams have reportedly been moving HYPE toward selling.
Source: Hyperliquid Daily on X, 11 August 2026. Source: CoinGlass, HYPE Spot ETF History, captured 11 August 2026.
Hyperliquid Liquidation Data Today
Liquidation flow on HYPE currently skews toward shorts getting squeezed rather than longs getting flushed, a detail that matters for this Hyperliquid breakout prediction.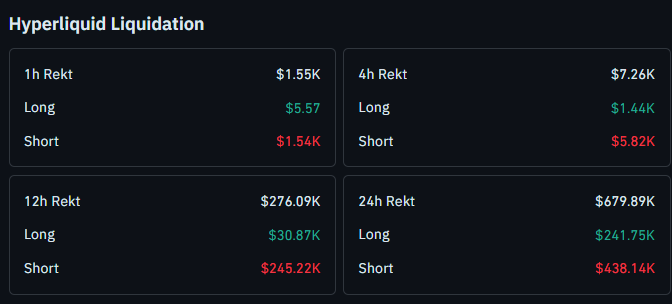
Over the last hour, total liquidations came to just $1.55K, with only $5.57 from longs against $1.54K from shorts.
The 4-hour window shows $7.26K in total liquidations, split between $1.44K in longs and $5.82K in shorts.
Zooming out to 12 hours, rekt totals reach $276.09K, with $30.87K from longs and $245.22K from shorts.
Over 24 hours, total liquidations hit $679.89K, made up of $241.75K in longs and $438.14K in shorts.
Shorts have been absorbing the bulk of the pain across every timeframe here, which fits a market that keeps failing to push price meaningfully lower despite the broader downtrend.
Source: CoinGlass, HYPE liquidation data, captured 11 August 2026.
Hyperliquid Trend and Momentum: Key Takeaways
HYPE is trading at 55.312, still respecting a descending trendline that has capped the price since late July
The decline has not been aggressive. Price has retested its first swing low three separate times without breaking it
A close above 56.441 would open the door to 60.429 and 63.450 as next resistance levels
A supportive Bitcoin and broader market backdrop could extend gains as far as 72.966
A close below 53.316 would flip the near-term structure bearish, with 51.135 as the next support
Short liquidations are outweighing long liquidations across every timeframe, which lines up with the trendline holding
Leveraged positions around any of these zones carry real liquidation risk, as the data above shows. These are chart-based levels, not guarantees.
Hyperliquid Price Prediction: 4-Hour Chart Analysis
Price is currently sliding down a descending trendline that has been intact since the price rolled over from its late July high.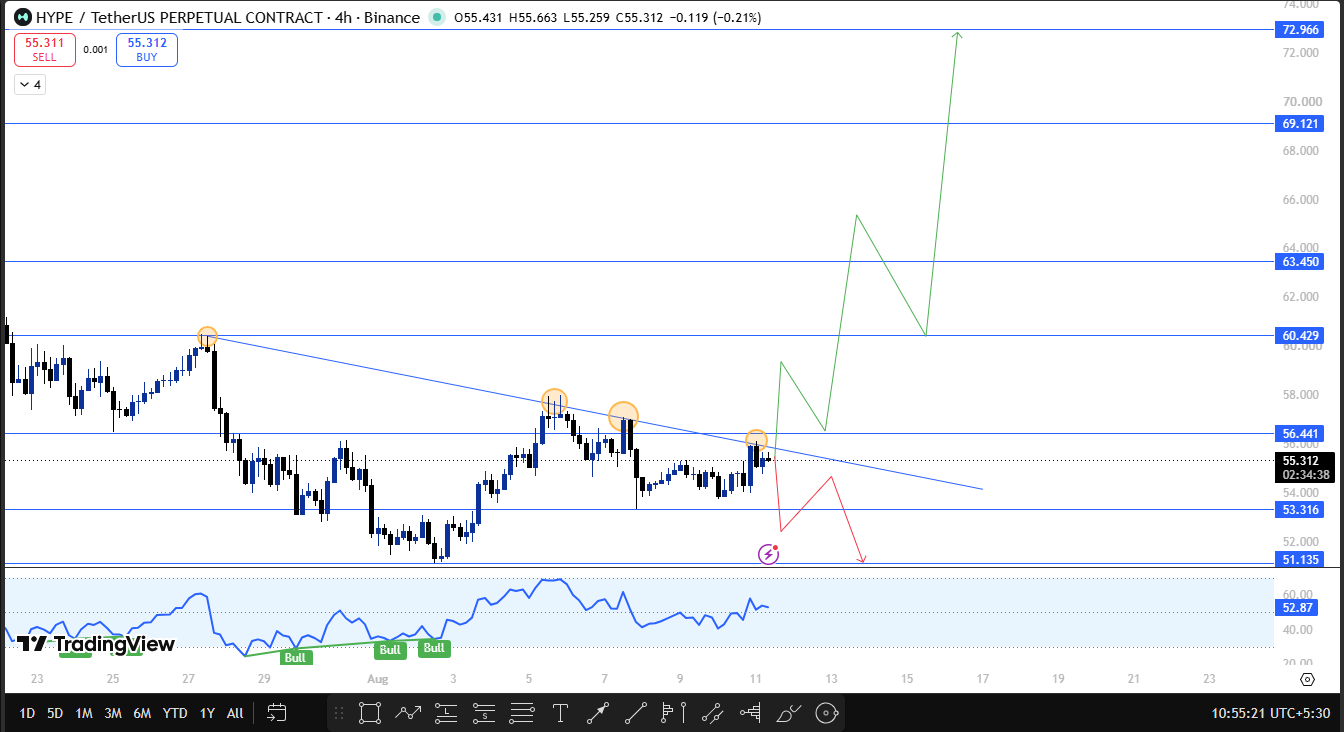
What stands out in this Hyperliquid technical analysis is not the direction, since the slide is clear, but the character of it. Selling has not been aggressive at any point along the way.
The clearest sign of that is structural. $HYPE tapped a swing low earlier in the move, and in the three retests since, price has not managed to break below that same low even once.
Each retest has instead found buyers stepping back in near the same zone, and price is still sustaining right on the descending trendline rather than accelerating away from it.
That sets up a fairly clean binary for this HYPE price prediction.
A 4-hour close above 56.441, roughly 2% above CMP, would be the first sign that the trendline is finally giving way to buyers.
From there, 60.429 becomes the next resistance, about 9.2% above CMP, followed by 63.450 close to 14.7% higher.
If that breakout coincides with a supportive Bitcoin and broader risk sentiment, this Hyperliquid price forecast extends further, with 69.121 in view around 24.9% above CMP and 72.966 as the extended target near 31.9% higher.
Both of those levels sit well beyond the immediate structure and would need strong follow-through volume to reach.
On the downside, the trendline itself remains the level to watch first. A 4-hour close below 53.316, about 3.6% under CMP, would suggest the current sustained attempt has failed.
The next support beneath that sits at 51.135, roughly 7.6% below CMP, and would be the first real test of whether the broader uptrend since earlier this year is still intact.
Hyperliquid Technical Outlook Snapshot
Indicator
Signal
Price Structure
Descending trendline, price sustaining on the line after three failed low retests
Momentum Oscillator RSI
Reading near 52.87, recent bull tags on the chart
Immediate Bias
Neutral, leaning cautious below 56.441
Bullish Trigger
4H close above 56.441
Bearish Trigger
4H close below 53.316
Invalidation
4H close below 51.135
Hyperliquid Support and Resistance Levels to Watch
Type
Level
Note
% From CMP
Resistance
$72.966
Extended target, needs strong BTC and market sentiment
+31.9%
Resistance
$69.121
Extended swing high
+24.9%
Resistance
$63.450
Prior swing high
+14.7%
Resistance
$60.429
Prior swing high
+9.2%
Resistance
$56.441
Descending trendline breakout trigger
+2.0%
Current Price
$55.312
Live CMP
0%
Support
$53.316
Trendline breakdown trigger
-3.6%
Support
$51.135
Invalidation level
-7.6%
Risk-Reward Table
Case
Trigger
Target
Bullish breakout
4H close above 56.441
60.429, then 63.450
Extended bullish
Breakout plus supportive BTC and market sentiment
69.121, then 72.966
Bearish breakdown
4H close below 53.316
51.135
Setup invalidation
4H close below 51.135
Broader uptrend structure at risk
Invalidation Level
This Hyperliquid price prediction treats a 4-hour close below 51.135 as invalidation for the bullish trendline-holding thesis.
Below that level, the case for HYPE respecting its longer-term structure weakens considerably, and the setup would need a fresh reassessment.
Trading leveraged positions around any of these zones carries genuine risk.
False breakouts above 56.441 or below 53.316 are possible before a level truly confirms, and the liquidation data above shows how quickly overleveraged positions on either side can get wiped out during these moves.
How Bitcoin Could Influence Hyperliquid
Bitcoin sentiment remains a major swing factor for this HYPE crypto forecast. HYPE's most bullish outcome, a run toward 69.121 and 72.966, is explicitly tied to a supportive Bitcoin and broader market backdrop rather than HYPE's chart alone.
A stable or rising Bitcoin would likely give HYPE more room to clear 56.441 and build toward those extended targets.
A risk-off shift in Bitcoin, by contrast, would make a break below 53.316 more likely even if HYPE's own structure looks resilient on paper.
Planned Update
This Hyperliquid price prediction will be revisited if price closes a 4 hour candle beyond either 56.441 or 53.316, or if no clear resolution happens within the next 24 to 48 hours of trading.
A meaningful shift in ETF flow data or a large liquidation event would also be a reason to update this Hyperliquid technical outlook sooner.
Glossary
Descending Trendline: A line connecting a series of lower highs, commonly used to track the pace and structure of a downtrend.
Open Interest: The total value of outstanding futures or perpetual contracts that have not yet been settled or closed.
Liquidation: The forced closure of a leveraged trading position by an exchange when losses erode the trader's margin below a required threshold.
Net Inflow: The amount of new capital entering an ETF product after accounting for both purchases and redemptions over a given period.
Invalidation Level: The price point at which a technical setup or forecast is considered no longer valid, prompting a reassessment of the outlook.
CoinGabbar's Technical Analyst View
Bull Case: HYPE closes a 4 hour candle above 56.441, confirming the descending trendline has broken, and momentum plus a favorable Bitcoin backdrop carry price toward 60.429, 63.450, and potentially as far as 72.966.
Base Case: HYPE continues to sustain along the descending trendline without a decisive close on either side of 56.441 or 53.316, resulting in a choppy, range-bound stretch as both buyers and sellers wait for confirmation.
Bear Case: HYPE closes below 53.316, breaking its recent pattern of defending the swing low, and slides toward 51.135, with a close below that level invalidating the broader bullish structure.
Disclaimer
This Hyperliquid price prediction is prepared for informational purposes only and should not be treated as financial or investment advice. Cryptocurrency markets, including HYPE, are highly volatile, and leveraged trading carries a significant risk of loss, including the risk of liquidation as shown in the data above. Readers should conduct their own research and consult a qualified financial advisor before making any investment decisions. CoinGabbar and the analyst preparing this piece do not hold a position at the time of publication.