Not a lot of certainty in HYPE today, just $54.76 and a small pullback. Market cap holds close to $12.2 billion, still enough to keep this one a real name among exchange-linked tokens, with t
Not a lot of certainty in HYPE today, just $54.76 and a small pullback.
Market cap holds close to $12.2 billion, still enough to keep this one a real name among exchange-linked tokens, with total value locked across its platform sitting north of $6 billion.
Sentiment's cooled a touch lately, partly tied to how the token's ETF products have been flowing.
Price itself sits right at a decision point; in this hyperliquid price prediction, there was a kind of setup that usually resolves one way or the other before too long.
Live Market Data
$HYPE is currently trading at $54.76, down 3.5% over the past 24 hours. Range for the day: $53.65 to $56.94.
Market cap: $12.176 billion; fully diluted valuation running much higher at $54.729 billion. 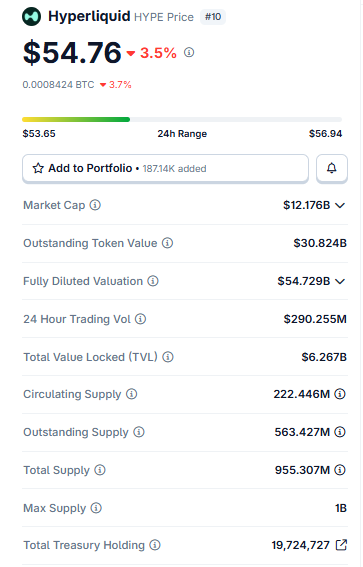
Source: Hyperliquid market cap data taken from Coingecko, data as of Aug 08, 2026. Figures may vary slightly across other tracking websites.
Volume over 24 hours landed at $290.255 million, with a total value locked at $6.267 billion.
Circulating supply sits at 222.446 million tokens against a 1 billion max supply, with treasury holdings near 19.7 million HYPE.
Liquidation Data
Longs have had the rough end of this lately, and it shows up fast. One hour: $426.85 total, $351.53 of that from shorts and longs, actually the smaller side there. 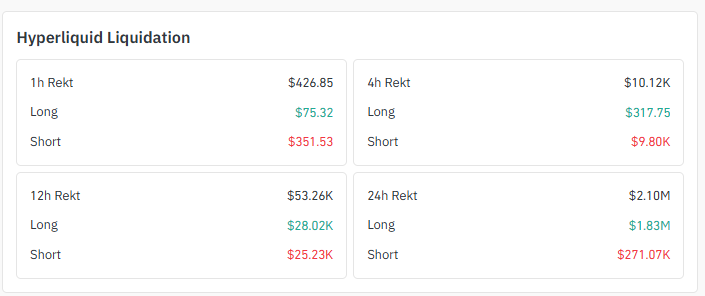
Source: Liquidation Data Taken From Coinglass.
Four hours flips it, $10.12K total, with shorts taking $9.80K. Twelve hours of even back out, $28.02K longs against $25.23K shorts.
Zoom out to a full day, though, and longs clearly lead, $1.83M against just $271.07K in shorts, $2.10M total.
Exchange Volume
For this Hyperliquid price prediction, Binance runs away with a futures volume of $406.74M and nothing else close. 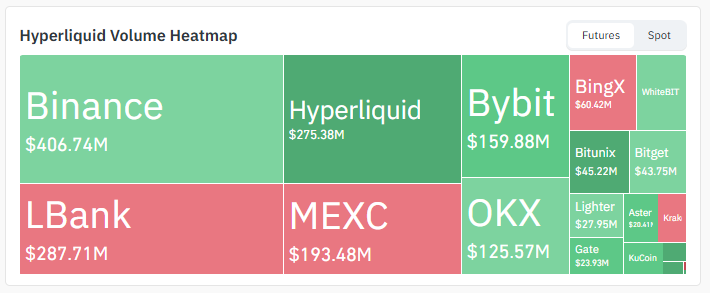
Source: Heatmap Data Taken From Coinglass
LBank sits second at $287.71M, and Hyperliquid's own platform is not far behind at $275.38M. MEXC logged $193.48M, and Bybit $159.88M.
OKX, BingX, Bitunix, and Bitget make up a decent tail beneath that.
Social Sentiment
Word going around: spot HYPE ETF products have seen mostly outflows since mid-July, just a couple of days of net inflows against roughly nine days of money leaving.
Monthly outflows landed north of $15 million.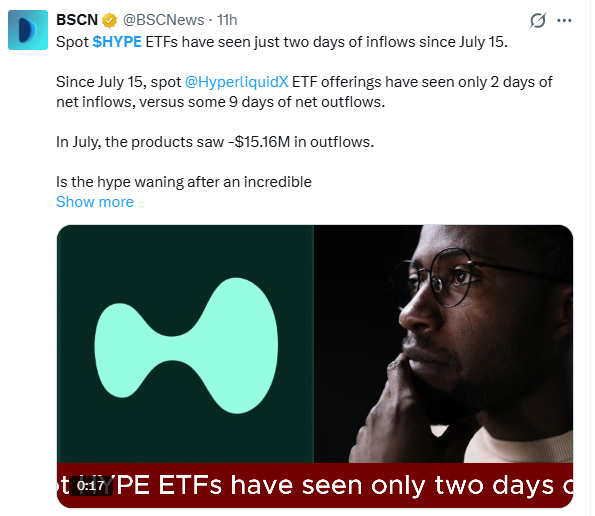
Source: Data Taken From @BSCNews, X Account.
It's raised a fair question in the community, whether momentum is genuinely cooling or this is just a quiet stretch after an otherwise strong run.
Key Takeaways
$54.76. HYPE, down 3.5% on the day, the anchor for this Hyperliquid price prediction.
Daily chart showing a symmetrical triangle. Clear the upper boundary with volume, and $67.65 opens up, then $76.88.
A Wolfe Wave pattern points higher still, toward the $91 to $92 zone, if the price can't hold near its old highs.
Rejected from the upper boundary instead? Drop to the lower boundary, break down there, and $44.52 comes into view, then $35.39.
Longs took the bigger liquidation hit over the past day, with $1.83M wiped out.
Technical Analysis for Hyperliquid Price Prediction
Here's what the daily chart behind this Hyperliquid price prediction actually shows. Price sits inside a symmetrical triangle. 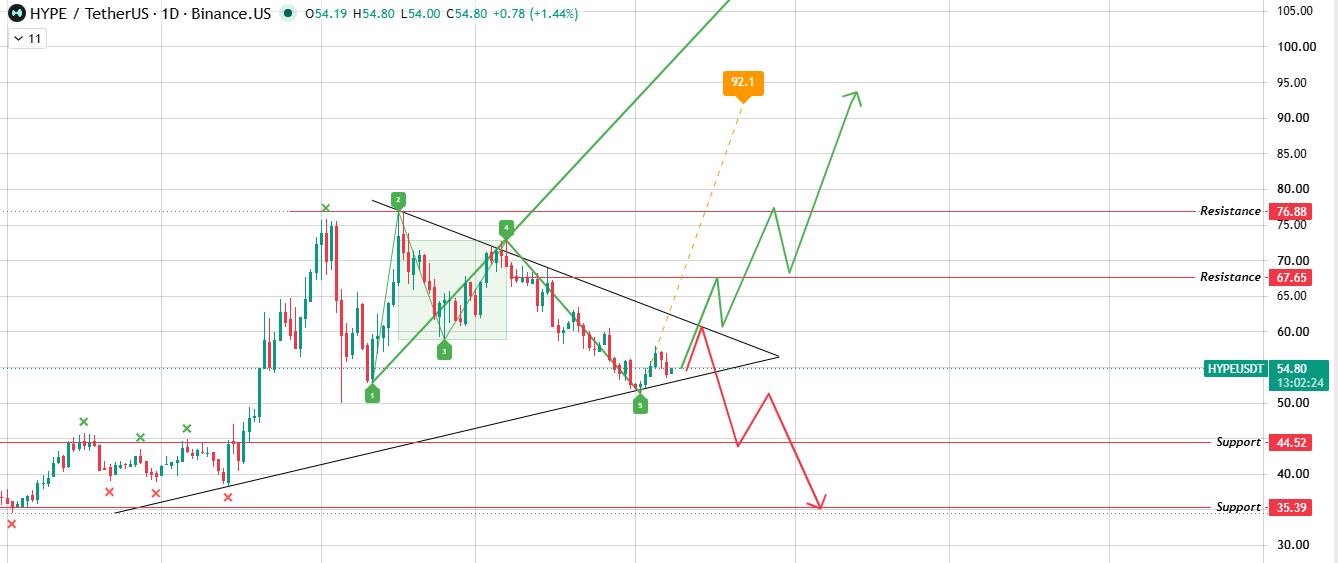
Source: Chart Taken From TradingView.
Clear the upper boundary with volume, and it's heading toward the upper resistance levels, $67.65 first, then $76.88.
A Wolfe Wave pattern on this chart points even further, suggesting the price could stretch toward $91 to $92 if it pushes near its old highs without holding there.
Get rejected from the upper boundary instead, drift down to the lower boundary, break through that, and the lower levels take over, $44.52 and then $35.39.
Bull, Base, and Bear Case
Clear the daily triangle's upper boundary with volume, and this Hyperliquid price prediction turns bullish fast, $67.65 and $76.88 first, the Wolfe Wave pointing toward $91 to $92 beyond that.
Flip it around: rejection at the top, a slide to the lower boundary, then a break through it, and sellers likely drag the price toward $44.52, then $35.39.
In between? Chop inside the triangle until somebody actually shows up with volume.
Glossary
Two lines closing in from opposite sides until the price has to pick a direction, that's a symmetrical triangle.
Ever heard of a Wolfe Wave? A five-point wave pattern traders use to project where a breakout is likely headed.
Resistance: a zone where selling has capped the price before, making the first push through tougher than it looks.
And support? Works the other way. A level buyers keep defending, right up until the moment they can't.
Methodology: Levels in this Hyperliquid price prediction trace back to daily chart analysis, including the Wolfe Wave marked on the chart. Liquidation figures come from Coinglass, and exchange volume comes from live futures heatmaps.
Disclaimer: This article is for informational purposes only and does not constitute financial advice. Cryptocurrency markets are highly volatile and speculative. Estimated probabilities reflect technical analysis of chart patterns, not certainty. Always conduct independent research and consult a licensed financial advisor before making investment decisions