Hyperliquid price prediction watchers have been waiting for exactly this moment for weeks, and the daily chart is finally giving them something worth talking about. After a long, grinding sli
Hyperliquid price prediction watchers have been waiting for exactly this moment for weeks, and the daily chart is finally giving them something worth talking about.
After a long, grinding slide, HYPE looks like it might have just turned a corner, and the way it got here is arguably more interesting than the move itself.
This breakdown is put together using chart structure, CoinGlass data, and fresh market news supplied for this piece.
The levels covered here come from the daily HYPE perpetual chart and represent a short- to medium-term view.
If the price moves decisively outside these ranges, this Hyperliquid price prediction should be revisited rather than assumed to still apply.
Hyperliquid (HYPE) Price Right Now
Metric
Value
Current Price (CMP)
$57.057
24-Hour Change
+1.78% (+0.997)
Market Cap
$14.36B
Futures Volume (24h)
$1.52B
Spot Volume (24h)
$74.98M
Open Interest
$2.36B
Circulating Supply
252.62M HYPE
Total Supply
952.67M HYPE
Max Supply
952.67M HYPE
Open interest sits at $2.36B right now, meaning that is the total value of HYPE futures contracts still open on the market.
A number this large relative to HYPE's market cap tells us leveraged traders have a heavy hand in how price reacts near the levels this Hyperliquid technical analysis is about to walk through.
Chart source: TradingView, HYPE/USDT Perpetual Contract, Binance, daily timeframe, captured 13 August 2026, around 11:00 AM IST (05:30 AM UTC). Data source: CoinGlass, Hyperliquid market page, captured 13 August 2026, around 11:00 AM IST.
Methodology and Data Sources
The structure behind this HYPE price prediction comes from a direct reading of the daily Hyperliquid perpetual chart on Binance, tracking the descending trendline and the recent swing levels marked on it.
Market data such as volume, open interest, and supply figures are pulled straight from CoinGlass, and liquidation numbers come from CoinGlass's own tracker for HYPE. News context is credited with its original source and timestamp.
Hyperliquid Pushes For A Regulated US Route
Fresh news adds real weight to this Hyperliquid price forecast beyond just the chart.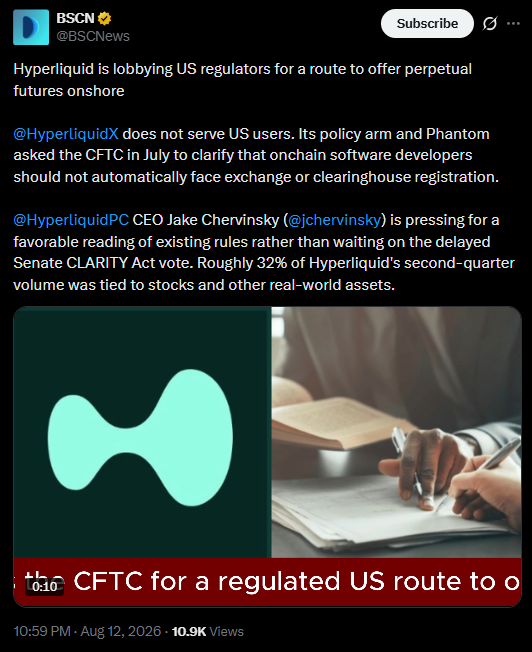
According to BSCNews, Hyperliquid is actively lobbying US regulators for a path to offer perpetual futures onshore, something the platform currently does not do for US users.
The report notes that Hyperliquid's policy arm, alongside Phantom, approached the CFTC back in July asking for clarity that onchain software developers should not automatically be treated as needing exchange or clearinghouse registration.
CEO Jake Chervinsky is reportedly pushing for a favorable interpretation of existing rules instead of waiting on the delayed Senate CLARITY Act vote, and the same report points out that roughly 32% of Hyperliquid's second quarter volume was already tied to stocks and other real-world assets.
That last figure matters. It shows Hyperliquid's business is not purely a crypto derivatives play anymore, and a friendlier US regulatory path could open the door to a much bigger addressable market down the line.
Source: BSCNews on X, 12 August 2026, 10:59 PM.
HYPE Liquidation Data Today
Liquidation flow on HYPE right now is heavily one-sided, and it lines up with the trendline break this Hyperliquid breakout prediction is built around.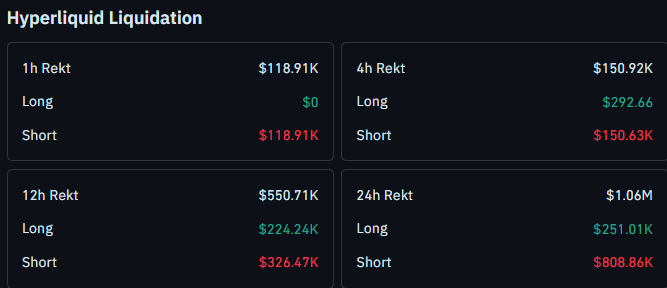
The last hour saw $118.91K in total liquidations, all of it from short positions, with longs untouched at $0.
Over 4 hours, total liquidations reached $150.92K, made up of just $292.66 in longs against $150.63K in shorts.
Stretching out to 12 hours, rekt totals climb to $550.71K, split between $224.24K in longs and $326.47K in shorts.
Across the full 24-hour window, total liquidations hit $1.06M, with $251.01K from longs and a much heavier $808.86K from shorts.
Shorts have taken the brunt of the damage across nearly every window here, which fits a market that just broke a downtrend and caught a lot of sellers off guard.
Source: CoinGlass, HYPE liquidation data, captured 13 August 2026.
Hyperliquid Trend and Momentum: Key Takeaways
HYPE is trading at 57.057, having just broken above its descending trendline on the daily chart
Price attempted a retest of the prior low but failed to set a fresh lower low, a sign sellers are losing grip
A close above 57.989 opens the path toward 63.450, then 69.121, 72.966, and 77.000
A close below 53.384 would flip the near-term picture bearish, pointing toward 51.135 next
Short liquidations are dominating across every timeframe, consistent with the trendline giving way
All support and resistance levels mapped here are drawn from recent swing highs and swing lows on the chart
Leveraged positions near any of these zones carry real liquidation risk, as the numbers above make clear.
These levels describe a chart-based framework, not a promise of what happens next.
Hyperliquid Price Prediction: Daily Chart Analysis
HYPE had been sliding down a descending trendline since late July, and for weeks that line held firm every time price tried to push back up through it. What changed recently is the way the most recent dip played out.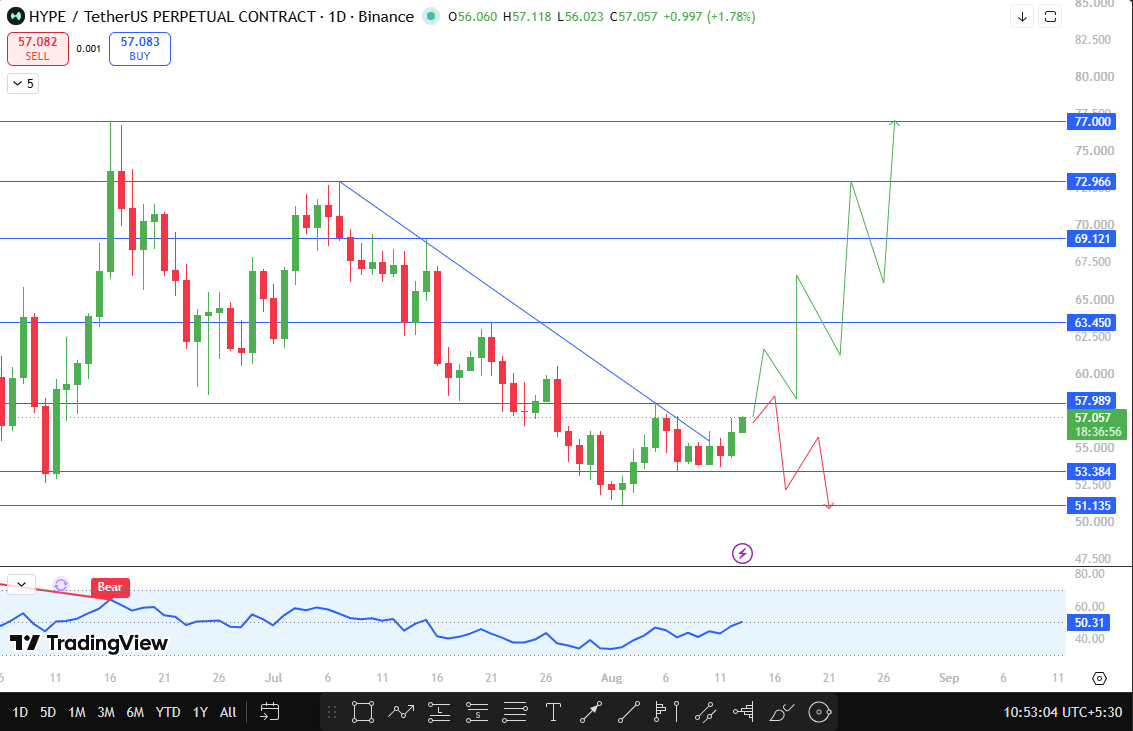
Instead of extending the downtrend, the price came back down to retest its prior swing low and simply could not get through it.
No fresh lower low formed. That failure to break down further is exactly the kind of detail that tends to get missed on a quick glance at the chart, but it is often the first tell that a trend is running out of steam.
From there, HYPE turned higher and cleared the descending trendline itself, which is the structural break this entire Hyperliquid price prediction now hinges on.
The next test is whether that strength can carry through the immediate resistance zone.
A daily close above 57.989, sitting only about 1.63% above CMP, would confirm the breakout is holding rather than fading.
From there, 63.450 becomes the next level in view, roughly 11.2% higher, followed by 69.121 around 21.1% above CMP.
If broader market sentiment stays supportive and Bitcoin cooperates, this Hyperliquid price forecast stretches further still, toward 72.966, near 27.9% above CMP, and eventually 77.000, close to 34.9% higher.
Both of those upper levels sit well beyond the immediate structure and would need sustained volume behind them to actually get tested.
On the downside, 53.384 is the level that matters most right now. A daily close below it, about 6.4% under CMP, would suggest this breakout attempt has failed and sellers are back in control.
Below that, 51.135 becomes the next support, roughly 10.4% lower, and would be the first real test of whether HYPE's broader structure since earlier this year still holds.
Hyperliquid Technical Outlook Snapshot
Indicator
Signal
Price Structure
The descending trendline is broken; the retest of the prior low failed to make a lower low.
Momentum Oscillator RSI
Reading near 50.31, a recent bear tag is visible near the trendline break.
Immediate Bias
Cautiously bullish above 57.989
Bullish Trigger
Daily close above 57.989
Bearish Trigger
Daily close below 53.384
Invalidation
Daily close below 51.135
Hyperliquid Support and Resistance Levels to Watch
Type
Level
Note
% From CMP
Resistance
$77.000
Extended swing high target
+34.9%
Resistance
$72.966
Recent swing high
+27.9%
Resistance
$69.121
Recent swing high
+21.1%
Resistance
$63.450
Recent swing high
+11.2%
Resistance
$57.989
Recent swing high, breakout trigger
+1.63%
Current Price
$57.057
Live CMP
0%
Support
$53.384
Recent swing low, breakdown trigger
-6.4%
Support
$51.135
Recent swing low, invalidation level
-10.4%
HYPE Risk-Reward Table
Case
Trigger
Target
Bullish breakout
Daily close above 57.989
63.450, then 69.121
Extended bullish
Breakout plus supportive BTC and market sentiment
72.966, then 77.000
Bearish breakdown
Daily close below 53.384
51.135
Setup invalidation
Daily close below 51.135
Broader bullish structure at risk
Invalidation Level
This Hyperliquid price prediction treats a daily close below 51.135 as the invalidation point for the current bullish thesis.
Below that swing low, the argument that HYPE has genuinely turned its structure around weakens considerably, and the setup would need a full reassessment.
Trading around any of these zones on leverage carries real risk.
False breakouts above 57.989 or false breakdowns below 53.384 are both possible before either level truly confirms, and the liquidation data above shows just how fast overleveraged positions on either side can get wiped out during moves like this.
How Bitcoin Could Influence Hyperliquid
Bitcoin remains a major swing factor for this HYPE crypto forecast.
The more ambitious upside targets here, 72.966 and 77.000, are explicitly tied to a supportive Bitcoin and broader risk backdrop rather than HYPE's own chart in isolation.
A steady or rising Bitcoin would likely give HYPE the room it needs to clear 63.450 and 69.121 on the way up.
A risk-off turn in Bitcoin, on the other hand, would make a slip back below 53.384 far more likely even with the trendline break already in place.
Planned Update
This Hyperliquid price forecast will be revisited if HYPE closes a daily candle beyond either 57.989 or 53.384, or if price fails to resolve clearly within the next 24 to 48 hours.
Any major shift in the CFTC regulatory conversation or a large liquidation event would also be reason enough to update this Hyperliquid technical outlook sooner.
Glossary
Descending Trendline: A line connecting a series of lower highs, used to track the pace and structure of a downtrend. Open Interest: The total value of outstanding futures or perpetual contracts that remain open and unsettled. Liquidation: The forced closing of a leveraged position by an exchange once losses eat through a trader's required margin. Swing High/Low: A short-term peak or trough on a chart, formed when price reverses direction, often used to mark support and resistance. Invalidation Level: The price point at which a technical outlook is no longer considered valid, requiring the setup to be reassessed.
CoinGabbar's Technical Analyst View
Bull Case: HYPE closes a daily candle above 57.989, confirming the trendline break is holding, and momentum combined with a favorable Bitcoin backdrop pushes price toward 63.450, 69.121, and potentially 72.966 or 77.000.
Base Case: HYPE holds above its broken trendline but struggles to clear 57.989 decisively, leading to a choppy stretch between roughly 53.384 and 57.989 as the market waits for confirmation either way.
Bear Case: HYPE closes below 53.384, undoing the recent trendline break, and slides toward 51.135, with a close below that level putting the broader bullish structure at risk.
Disclaimer
This Hyperliquid price prediction is prepared for informational purposes only and should not be treated as financial or investment advice. Cryptocurrency markets, including HYPE, are highly volatile, and leveraged trading carries significant risk of loss, including liquidation, as shown in the data above. Readers should conduct their own research and consult a qualified financial advisor before making any investment decisions. CoinGabbar and the analyst preparing this piece do not hold a position in HYPE at the time of publication.