Hyperliquid price remained close to its record high on Sep. 9 as buyers absorbed an estimated $820 million token unlock, although weakening daily momentum and heavy liquidity near $87–$90 cou
Hyperliquid price remained close to its record high on Sep. 9 as buyers absorbed an estimated $820 million token unlock, although weakening daily momentum and heavy liquidity near $87–$90 could slow the next advance.
Summary
- Hyperliquid price gained about 4.9% from its Sep. 3 opening price to trade near $85.84.
- The token reached an all-time high of $89.57 on Sep. 6 before entering consolidation.
- 4-hour moving averages place immediate support between $83.29 and $85.91.
- Liquidation clusters near $87 and $83.50 could shape HYPE’s next short-term move.
Hyperliquid price consolidates below $90
Hyperliquid (HYPE) price traded at $85.84 at the time of writing on Sep. 9, holding most of its gains after a volatile six-day period. HYPE opened near $81.82 on Sep. 3, placing its net gain at approximately 4.9%.
The token initially climbed to $87.99 before market-wide selling interrupted the advance. HYPE then recovered and reached an all-time high of $89.57 on Sep. 6, showing greater relative strength than several large-cap cryptocurrencies during the broader correction.
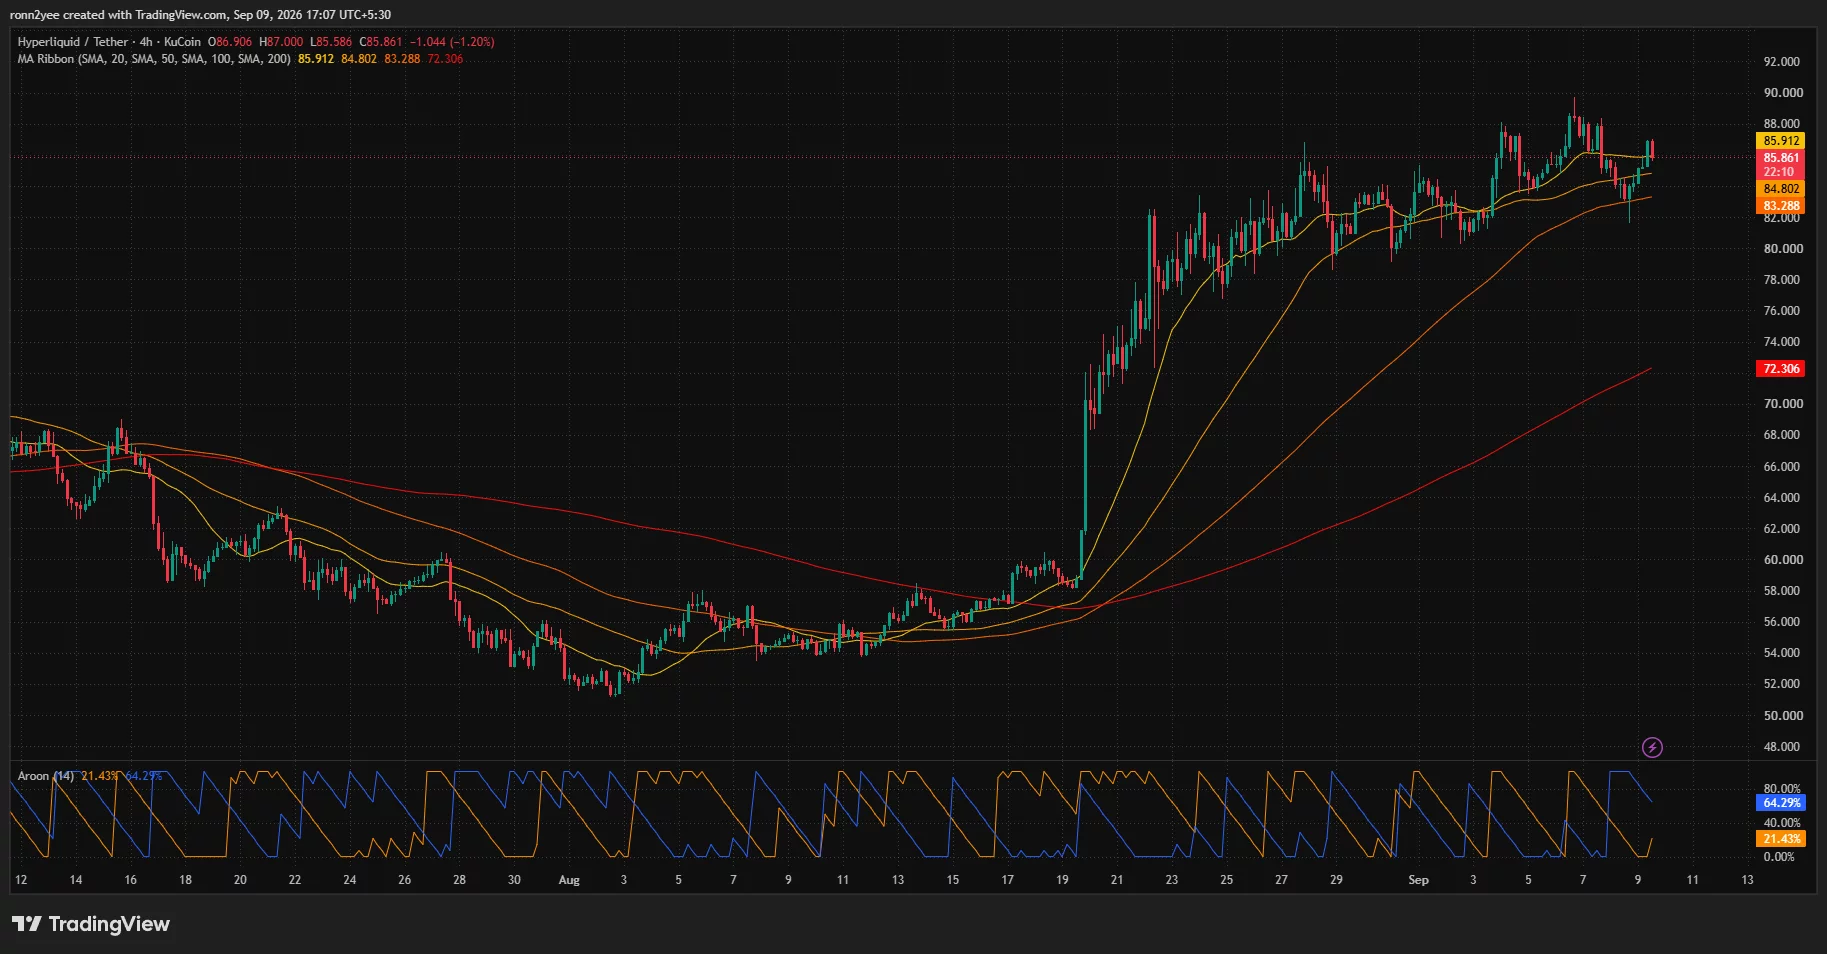
Price action has since narrowed between roughly $84 and $88 as traders test demand below the record high. The daily chart shows that buyers have repeatedly stepped in around $84.70–$85, while attempts to hold above $87 have attracted selling.
Hyperliquid price daily chart — Sep. 9 | Source:
crypto.newsHYPE’s daily Relative Strength Index stood at 62.98, down from its RSI moving average of 66.88. The indicator remains above the neutral 50 level but shows that bullish momentum has cooled since the record-setting move.
The daily moving average convergence divergence indicator has also weakened. Its MACD line fell to 5.301, below the 5.788 signal line, while the histogram slipped to -0.486. The bearish crossover points to slower short-term momentum rather than a confirmed reversal, as the token remains near its high.
You might also like: Hyperliquid unlocked $820 million in HYPE tokens. Here is why that number is misleading.
Token unlock meets sustained protocol demand
HYPE’s resilience followed the Sep. 6 unlock of about 9.92 million tokens allocated to core contributors. The tokens were worth approximately $820 million at the prices recorded around the event.
Large unlocks can raise selling pressure by expanding the amount of supply available to holders. However, only a small portion of the newly unlocked HYPE was reportedly claimed or moved toward venues associated with selling, limiting the immediate impact on the market.
Demand from Hyperliquid’s fee-funded assistance fund also helped offset supply concerns. The mechanism uses most of the protocol revenue assigned to the fund to purchase HYPE from the market, linking token demand to activity on the trading platform.
Hyperliquid open interest reached $14.3 billion during the period, indicating that traders maintained substantial derivatives exposure despite the broader market decline. High open interest can support trading-fee generation, though it also raises the risk of sharper moves if leveraged positions unwind together.
Broader markets faced pressure as tensions between the United States and Iran pushed oil toward $100 per barrel. Strong U.S. employment data and a rise in the 10-year Treasury yield to 4.784% also reduced demand for risk assets.
The resulting crypto sell-off liquidated about $188 million in long positions on Sep. 4. HYPE briefly fell toward $83.68 during the event but recovered faster than much of the market.
HYPE price faces resistance from $87 to $90
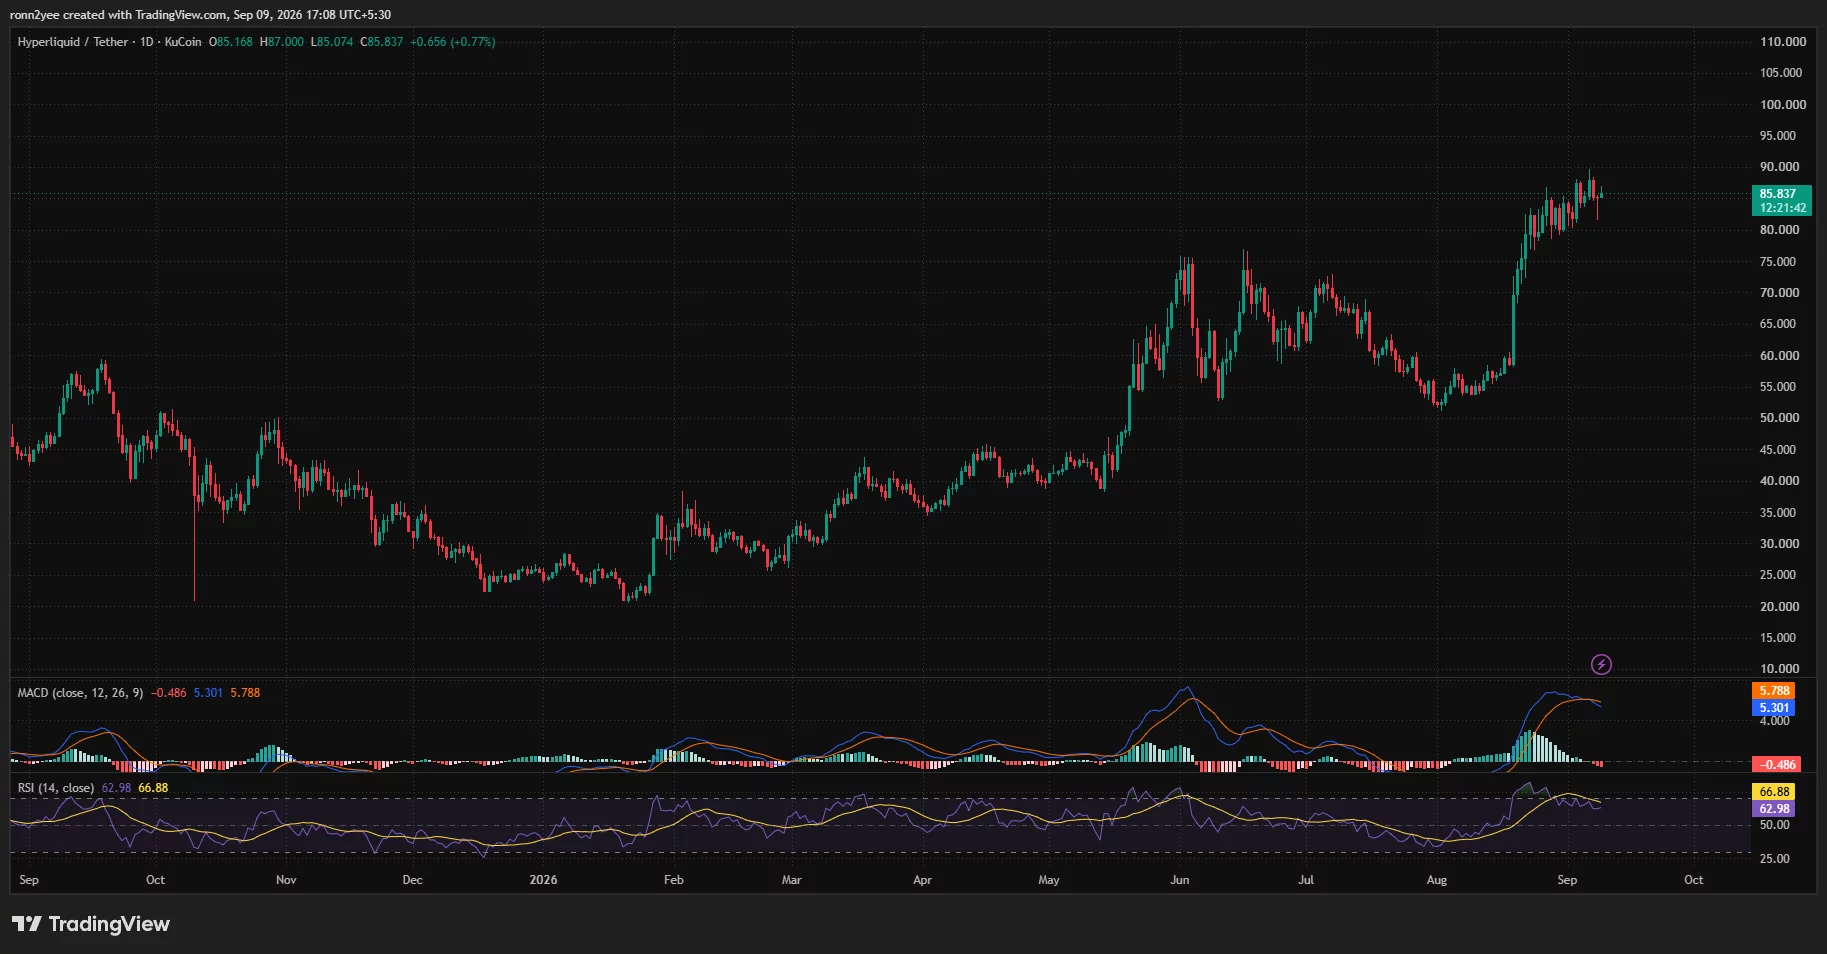
The four-hour chart places HYPE close to its 20-period simple moving average at $85.91. A sustained move above that level could give buyers another opportunity to challenge $87 and the record-high region.
Hyperliquid price 4-hour chart — Sep. 9 | Source:
crypto.newsLower support comes from the 50-period SMA at $84.80 and the 100-period SMA at $83.29. The alignment of the 20-, 50-, 100-, and 200-period averages remains bullish, with each shorter average positioned above the longer one.
The four-hour Aroon Up reading of 64.29% also exceeded Aroon Down at 21.43%. The gap suggests that recent highs still carry more weight than recent lows, although neither reading shows complete control.
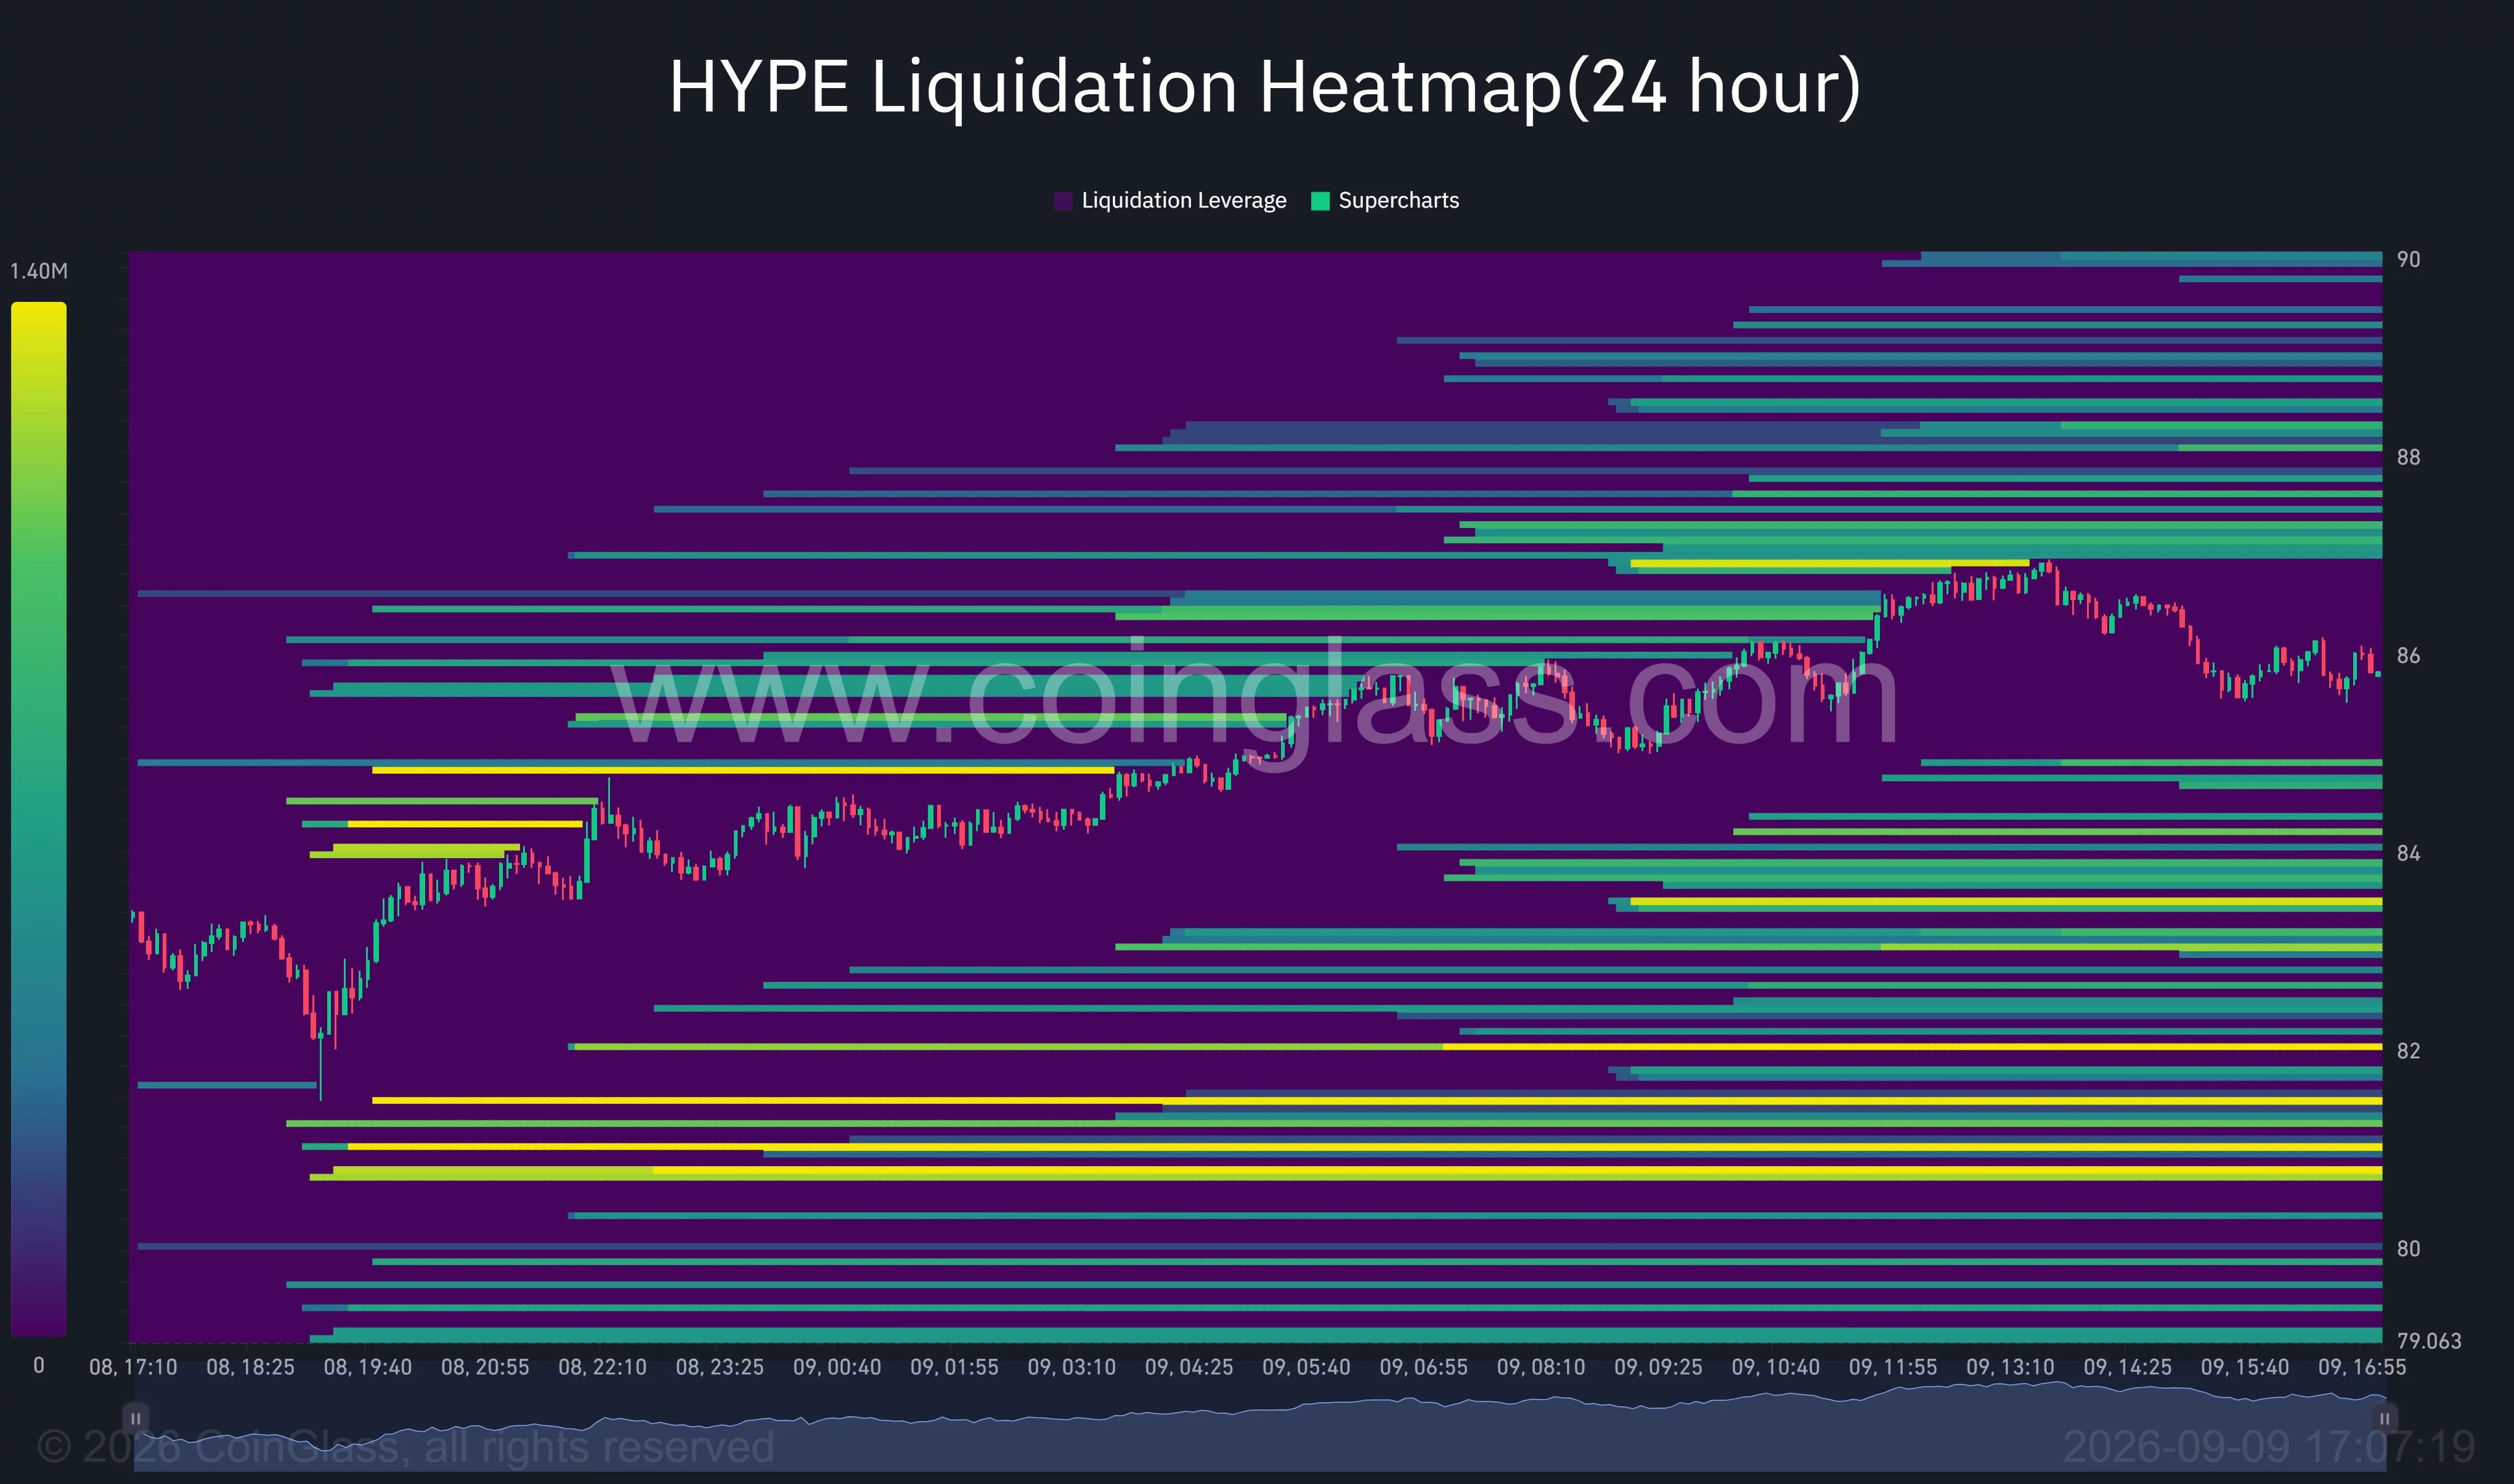
CoinGlass’ 24-hour liquidation heatmap shows a nearby concentration of leveraged positions around $86.80–$87.20. A move through that area could force short liquidations and help HYPE retest $88–$90.
Hyperliquid liquidation heatmap | Source:
CoinGlassLiquidity below the market is concentrated near $84, $83.50, and $82. Larger bands appear around $80.70–$81.50, making that region a potential downside target if the nearer moving-average support fails.
A daily close above $89.57 would place HYPE in price discovery and bring the psychological $100 level into view. Failure to defend $83.29 would weaken the short-term structure and expose $82, followed by the four-hour 200-period SMA near $72.31.
Analysts remain cautious near the supply zone
Crypto analyst CryptoPatel said in a Sep. 8 post that HYPE was trading inside a daily supply and resistance zone between $84 and $90. The analyst viewed $90 as the invalidation level for a corrective setup and identified $76, $68, and $60 as possible downside levels if sellers take control.
Team LAMBO Charts separately placed the main resistance area between $90 and $95. The analyst said sellers had previously entered around that region and wanted to see stronger volume before treating another test as a confirmed breakout.
Both views identify $90 as the level that separates continued consolidation from a possible bullish expansion. Their longer-term support projections sit well below the immediate levels shown by the four-hour moving averages, reflecting the difference between a short-term pullback and a wider structural correction.
For U.S. traders, Treasury yields, oil prices, and expectations for Federal Reserve policy remain external risks. HYPE has resisted the latest market decline, but another increase in yields or inflation concerns could trigger renewed deleveraging across speculative crypto positions.
The immediate setup, therefore, depends on whether buyers can reclaim $87 and close above $89.57. Until then, HYPE remains in a bullish broader trend but faces fading momentum and concentrated resistance below $90.
Disclosure: This article does not represent investment advice. The content and materials featured on this page are for educational purposes only.
Read more: Bitcoin price tests $78K as bearish divergence grows