Key Takeaways HYPE has slipped below the 50% retracement of its spring advance. The token is testing its 100-day moving average near $56.7. Recovering $57.6 could support a rebound toward $62
Key Takeaways
- HYPE has slipped below the 50% retracement of its spring advance.
- The token is testing its 100-day moving average near $56.7.
- Recovering $57.6 could support a rebound toward $62.
- A confirmed loss of the current support zone would expose $53.
- HYPE does not yet have enough trading history for a 200-day moving average.
HYPE trades near $57 at the time of writing after slipping beneath the 0.5 Fibonacci retracement close to $57.6. That level marks the midpoint of the token’s advance from approximately $38 to $77.
The pullback has brought price directly to the 100-day simple moving average near $56.7. Together with the psychological $57 level, it forms the final visible support zone before the deeper 0.618 Fibonacci retracement near $53.
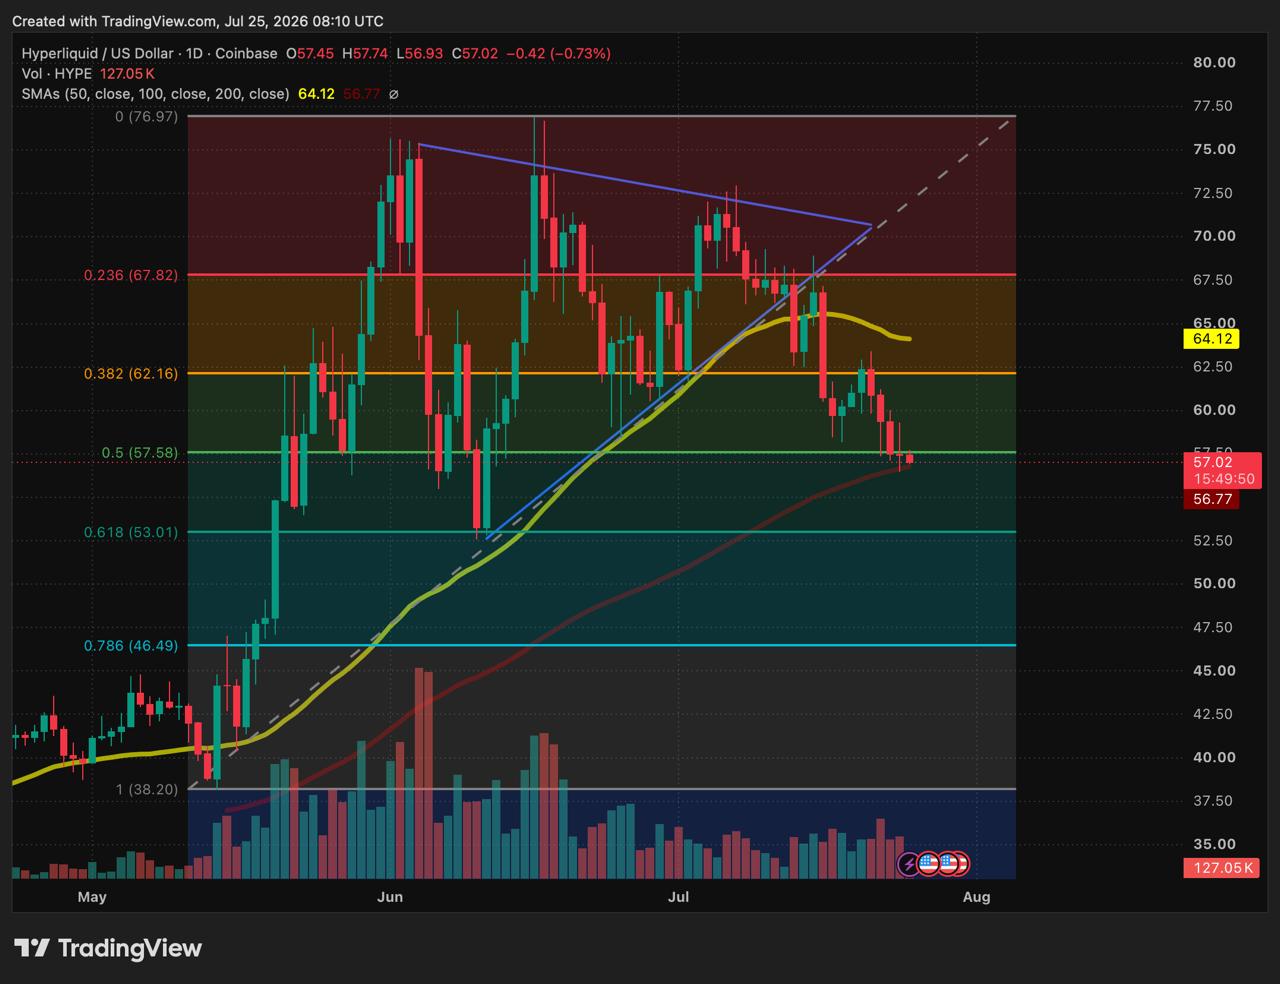
Daily Hyperliquid technical price chart with Fibonacci levels /
Source: TradingViewHYPE has already broken below the rising trendline that supported its advance from the June low. It also trades beneath the 50-day simple moving average near $64 and has formed a sequence of lower recovery highs since approaching $77.
The same support zone was already under pressure a day earlier, as ETF demand weakened while HYPE tested this crucial level.
The 100-day average is therefore the clearest remaining measure of medium-term support. An intraday move beneath it would carry less weight than a completed daily candle, particularly while price remains close to the 50% retracement.
A close back above the current support zone would show that buyers are still defending half of the spring rally. Acceptance below it would indicate that the correction is extending into a deeper part of the Fibonacci range.
A Recovery First Needs to Reclaim $57.6
The first sign of stabilisation would be a move back above the 0.5 retracement near $57.6.
If that level is recovered, the next resistance sits around $62, corresponding with the 0.382 retracement. This area previously acted as support and could now attract sellers looking to exit during a rebound.
Beyond $62, the falling 50-day average near $64 is the more important barrier. Until HYPE recovers it, an advance from the current level would remain a relief bounce inside a weakening structure rather than a confirmed trend reversal.
The next major resistance above the moving average is the 0.236 retracement near $67.8. Reclaiming that area would begin to challenge the sequence of lower highs established since June.
Price LevelTechnical Role
$57.6The midpoint of the spring rally and the first level HYPE needs to reclaim.
$56.7The 100-day moving average supporting the current price zone.
$62Former support and the first meaningful resistance on a rebound.
$64The falling 50-day average separating a relief bounce from a stronger recovery.
$53The 0.618 retracement and the next major support below the current zone.
A Daily Close Below the 100-Day Average Exposes $53
A completed candle beneath the 100-day average and the wider $57 shelf would weaken the remaining medium-term support structure.
The next measured level is the 0.618 Fibonacci retracement near $53. A move there would mean HYPE had surrendered more than 60% of its advance from $38 to $77.
Buyers could still attempt to form a base around that level, but a weak reaction would place the 0.786 retracement near $46.5 back into focus. Reaching that area would unwind most of the spring rally and return price much closer to its origin.
READ MORE:
 Hyperliquid’s $1.2B Fee Engine Puts HYPE in Focus
The Daily Close Will Confirm the Next Move
The chart is no longer best described through a triangle because the trendlines that formed it have already been broken. The cleaner structure is defined by the current $56.7–$57.6 decision zone, resistance at $62 and deeper support at $53.
The chart also does not provide a valid 200-day moving average because HYPE lacks sufficient Coinbase trading history. For now, the 50-day and 100-day averages, together with the Fibonacci grid, provide the relevant technical framework.
- Disclaimer: This article is for informational purposes only and isn’t financial advice. Technical levels reflect chart conditions at the time of writing, not price predictions – HYPE is a newer, highly volatile asset. Always do your own research before trading.
- Methodology: Price levels are based on the daily HYPE/USD chart on Coinbase via TradingView, captured July 25, 2026.
The post Hyperliquid Tests $57 After Losing Half Its Spring Rally appeared first on Coindoo.