What to Know ICON trades near $0.015118, above its Bollinger Band midline, with recent price gains indicating improving momentum despite earlier market weakness. ICX’s RSI stands at 54.90, in
What to Know
-
ICON trades near $0.015118, above its Bollinger Band midline, with recent price gains indicating improving momentum despite earlier market weakness.
-
ICX’s RSI stands at 54.90, indicating strengthening buying momentum, while remaining below overbought territory and leaving room for further gains.
-
Breaking above $0.016618 could support a move toward $0.02, while losing $0.013425 would weaken the token’s current recovery prospects significantly.
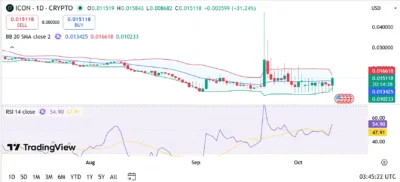
ICON (ICX) trades near $0.015118, with its daily chart showing improving price momentum following a prolonged decline through August and early September. According to TradingView chart, the token remains above its 20-day Bollinger Band average at $0.013425 and below the upper band at $0.016618.
The latest daily candle shows a 31.24% gain, with ICX opening at $0.011519, reaching a high of $0.015843, and recording a low of $0.008682. This substantial price movement follows several weeks of consolidation, during which buyers and sellers struggled to establish a sustained directional trend.
The Relative Strength Index stands at 54.90, above its moving average of 47.91 and the neutral threshold of 50. These readings indicate improving buying momentum without suggesting overbought conditions. ICX is the native cryptocurrency of the ICON blockchain, supporting network transactions, staking, and governance participation.
Also Read: Beam (BEAM) Price Prediction 2026–2030: Can BEAM Hit $0.005 Soon?
Market Structure and Price Action
ICON’s daily chart shows a prolonged downward movement from July through early September, with prices declining from approximately $0.025 toward the $0.01 region. The decline gradually weakened before increased volatility emerged during September.
A substantial upward price spike briefly carried ICX above $0.04, although buyers failed to sustain those gains, resulting in a rapid reversal toward the previous trading range. The subsequent consolidation established a narrower trading structure between approximately $0.011 and $0.016, with recent candles showing renewed buying activity.
The Bollinger Band midline at $0.013425 represents an important support reference. Maintaining prices above this level would strengthen the recovery structure, while a breakdown could expose the lower band near $0.010233. A sustained move above $0.016618 would improve the bullish outlook and potentially open the way toward the psychological $0.02 resistance level.
Bollinger Bands Indicate Improving Price Strength
ICX currently trades in the upper half of its Bollinger channel, reflecting stronger buying activity relative to its recent average price. The token’s position above the $0.013425 midline indicates improving short-term momentum. The upper Bollinger Band at $0.016618 represents the nearest indicator-based resistance, approximately 9.9% above the displayed price.
Breaking above this level could support a challenge of $0.02, representing approximately 32.3% upside from the current price. Conversely, a sustained decline below the middle band would weaken the recovery structure and bring the lower Bollinger Band at $0.010233 into consideration.
RSI Signals Strengthening Buying Momentum
The RSI reading of 54.90 indicates moderately bullish momentum, with the indicator moving above the neutral threshold of 50. Its position above the RSI moving average of 47.91 further suggests that buying strength has improved relative to recent sessions.
A continued advance toward 60 could reinforce bullish momentum, while movement above 70 would indicate overbought conditions. Alternatively, a decline below 50 would suggest weakening buying activity, particularly if accompanied by a breakdown beneath the Bollinger Band midline.
Source: Tradingview
ICX Price Predictions (2026–2030)
Year
Minimum Price Scenario
Average Price Scenario
Maximum Price Scenario
2026
$0.0100
$0.0155
$0.0200
2027
$0.0110
$0.0180
$0.0280
2028
$0.0130
$0.0220
$0.0350
2029
$0.0150
$0.0270
$0.0450
2030
$0.0180
$0.0330
$0.0550
Yearly Insights
2026
ICX’s remaining 2026 outlook depends on maintaining support above $0.013425 and overcoming resistance near $0.016618. A successful breakout could support a move toward $0.02, while renewed selling pressure could push prices toward the lower Bollinger Band near $0.010233.
2027
Improving market conditions and stronger demand could support an advance toward $0.028 under favorable circumstances. Establishing consistent support above $0.02 would strengthen this scenario, although limited buying activity could keep ICX trading within a narrower range.
2028
A sustained cryptocurrency market expansion could allow ICX to challenge $0.035. Reaching this level would require stronger buying momentum, improved liquidity, and a sustained breakout above previous resistance levels.
2029
The bullish scenario places ICX near $0.045 if broader cryptocurrency adoption and network participation support stronger token demand. Conversely, prolonged market weakness could limit price appreciation and maintain consolidation around lower support levels.
2030
A favorable long-term scenario allows ICX to approach $0.055, supported by sustained demand and improving market conditions. Nevertheless, the supplied daily chart provides no technical confirmation or reliable timetable for reaching this target.
Conclusion
ICON shows improving short-term momentum, with its price trading above the Bollinger Band midline at $0.013425 and RSI standing at 54.90. The latest 31.24% daily gain indicates renewed buying activity, although resistance near $0.016618 remains an important obstacle.
A sustained breakout above $0.016618 could strengthen the recovery outlook and support a challenge of $0.02, approximately 32.3% above the displayed price. Conversely, losing support at $0.013425 would weaken the bullish structure and potentially expose the lower Bollinger Band near $0.010233.
FAQs
1. What is the immediate support level for ICX?
The nearest indicator-based support is approximately $0.013425, corresponding to the 20-day Bollinger Band midline. The lower band at $0.010233 provides another reference if selling pressure increases.
2. What is the next major resistance for ICX?
The upper Bollinger Band at $0.016618 represents the nearest resistance level, followed by the psychological $0.02 barrier.
3. What does ICX’s RSI indicate?
The RSI reading of 54.90 indicates moderately bullish momentum. Its position above the moving average of 47.91 suggests improving buying strength without confirming overbought conditions.
4. Can ICX reach $0.02 before 2030?
ICX could reach $0.02 if buyers sustain momentum and overcome resistance at $0.016618. The target represents approximately 32.3% upside from the displayed price, although the current chart does not confirm when a breakout might occur.
5. Why is the Bollinger Band midline important?
The midline represents the 20-day simple moving average. Holding above $0.013425 would indicate continued price strength relative to recent trading, while losing this level could signal weakening bullish momentum.
Also Read: Hydration (HDX) Price Prediction 2026–2030: Can HDX Hit $0.01 Soon?
The post ICON (ICX) Price Prediction 2026–2030: Can ICX Hit $0.02 Soon? appeared first on 36Crypto.