A coin sitting near $0.38 doesn't usually jump to $0.91 in a single day. This one did. The latest iExec RLC price prediction starts with a 139.45% daily surge. Readers trackingcrypto price pr
A coin sitting near $0.38 doesn't usually jump to $0.91 in a single day. This one did.
The latest iExec RLC price prediction starts with a 139.45% daily surge. Readers trackingcrypto price prediction updates will want the full RLC price today story.
iExec RLC Price Today: Market Data Snapshot
Snapshot time: October 6, 2026, around 9:00 UTC, with figures fromCoinMarketCap market data.
Metric
Value
Price
$0.9145
24H change
+139.45%
7D change
+162.56%
24H trading volume
$237.21M
Market cap
$79.56M
Circulating supply
86.99M RLC
Max supply
86.99M RLC
24H range
$0.3811 to $0.9477
All-time high
$16.26 (May 10, 2021)
Rank
#295
Volume ran at 295.59% of market cap. That's pure speculation fuel.
Quotes differ by a few cents across platforms, simply because of timing.
Why Is RLC Up Today?
Breaking: RLC rocketed 139.45% in 24 hours. Trading volume exploded to $237.21M.
Shorts got hit hard, with $6.28M liquidated against $2.42M in longs. Daily candles escaped a descending channel that held since May.
The data offers no verified answer to why is $RLC up today, only flows. Anyone hunting a catalyst can scanAI crypto news for fresh developments.
Until real news lands, this is a flow-driven move.
Trading Volume and Derivatives Activity
Futures volume hit $1.33B, while spot volume reached only $90.02M, based onCoinGlass derivatives data. That's nearly 15 times more futures action than spot buying.
Open interest, the total value of open futures bets, sits at $65.04M.
And Binance's long/short ratio of 0.6036 means more accounts bet against the rally than for it, since readings below 1 mean shorts outnumber longs.
Crowded shorts can feed squeezes. But they can also signal that experienced traders expect a fade.
$RLC Technical Analysis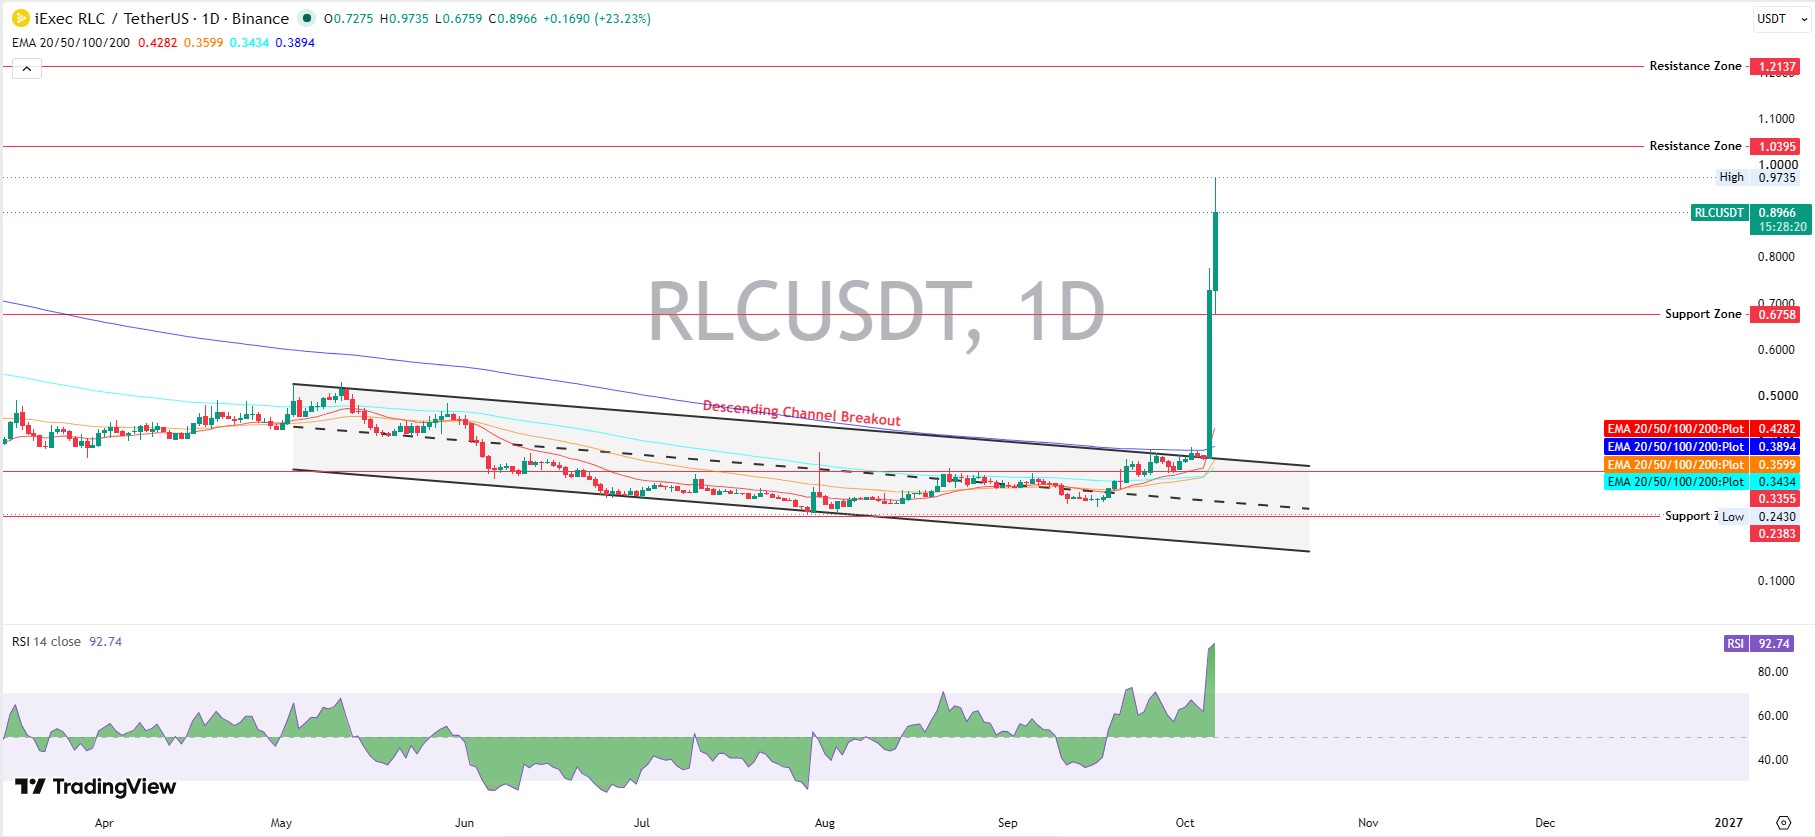
$RLC technical analysis starts with structure. On the TradingView daily chart, where each candle equals one day of trading, RLCUSDT on Binance exited a descending channel, a falling price lane.
That channel capped rallies since May. Not a slow climb out, but a vertical sprint.
This $RLC breakout carried trades to $0.9735 before easing to $0.8966 on Binance.
One tall candle isn't a trend yet. Bulls need two things. Volume that stays loud and a floor above $0.6758.
RSI and EMA Readings
RSI, the relative strength index, measures buying momentum on a 0 to 100 scale. Readings above 70 mean overheated, and $RLC sits at 92.74.
Overbought doesn't guarantee a drop. It does raise correction risk.
EMAs, or exponential moving averages, track average trading prices with extra weight on recent days. EMA 20 sits at $0.4282, EMA 50 at $0.3599, EMA 100 at $0.3434, and EMA 200 at $0.3894.
Price trades more than double every one of them. Stretched is the polite word.
Spikes like this attract the crowd that followsmemecoin news. That crowd tends to arrive late.
Key Support and Resistance Levels
$RLC support and resistance zones come straight from the daily chart.
Support starts at $0.6758, then $0.3355 and $0.2383. Resistance starts at $1.0395, then $1.2137.
Binance's $0.9735 high adds a nearer ceiling for now.
One number matters most right now. $0.6758.
A trade below it puts the whole breakout on trial.
Whale Concentration and Token Supply
Etherscan holder data counts 26,772 holders. But the top 100 wallets control 86.17% of supply.
Just 60 whale wallets hold 82.04%. The top 10 own 54.20%.
That concentration cuts both ways. A few wallets can fuel a rally, and a few can end it.
Token unlock data updated October 6, 2026, lists 80.99M RLC unlocked and 6M RLC, or 6.9%, still locked.
Can RLC Reach $1? Bull, Base and Bear Cases
Can $RLC reach $1? That level sits roughly 9% above $0.9145.
So who's left to buy after a 139% day?
Bull Case
Timeframe: days to weeks. If $RLC holds above $0.6758 and breaks $1.0395 on heavy volume, an $RLC price target near $1.2137 comes into play.
Invalidation: a trade below $0.6758. A confirmed listing would add fuel, so trackingnew exchange listings makes sense.
Base Case
Timeframe: one to two weeks. A cooldown between $0.6758 and $0.9735 fits an overheated chart, and a pullback is more likely than a straight run to $1.2137.
That sounds bearish. Actually, the structure is still bullish, just tired.
Bear Case
Timeframe: one to four weeks. A breakdown below $0.6758 could drag trades toward $0.4282, then $0.3355.
Key risk: whales selling into the spike.
$RLC Price Prediction for 2026
The $RLC price prediction 2026 outlook stays scenario-based.
Bull: $1.0395 to $1.2137 if the breakout holds
Base: $0.6758 to $0.9735 as price digests gains
Bear: $0.3355 to $0.4282 if the rally unwinds
Catalysts matter more than charts here. Acoin events calendar helps track upcoming developments, and any iExec price forecast past year-end is guesswork.
Risks That Could Change the iExec RLC Price Prediction
Any iExec RLC price prediction carries risk. RSI at 92.74 invites profit-taking.
Whale concentration and futures-heavy volume make sharp reversals easy.
And $RLC trades 94.34% below its $16.26 all-time high from May 10, 2021.
But hype rotates fast, and freshcrypto airdrops can pull speculative cash elsewhere.
Final Takeaway
This iExec RLC price prediction stays bullish on structure and overheated on momentum. A pullback before any run at $1.0395 is the more likely path.
Bulls own the trend while $0.6758 holds. But a 139% day rarely rewards late buyers.
Early-stage hunters can browsepresale and ICO listings for fresh setups.
Disclaimer: This article is for information only and isn't financial advice. Crypto prices are volatile, no outcome is guaranteed, and readers should do independent research before trading.