Immutable's chart has been unwinding sharply through late July, yet one number keeps moving the other way: its holder count is still climbing even as price slides toward the $0.10 zone. Immut
Immutable's chart has been unwinding sharply through late July, yet one number keeps moving the other way: its holder count is still climbing even as price slides toward the $0.10 zone.
Immutable is a layer-2 blockchain built specifically for web3 gaming, according to its own project materials, giving game studios a scalable settlement layer for in-game assets and NFTs.
This Immutable Price Prediction August 2026 looks at whether an oversold RSI reading sets up a short-term bounce.
Read on for the full level-by-level breakdown.
IMX Price Prediction Today: Market Overview and IMX Price Movement
Metric
Value
Price
$0.10783
24h Change
−0.95%
Market Cap
$216.32M (−0.95%)
Unlocked Market Cap
$216.32M
24h Volume
$8.87M (−10.07%)
Vol/Mkt Cap (24h)
4.12%
FDV
$216.32M
Total Supply
2B IMX
Max Supply
2B $IMX
Circulating Supply
2B $IMX
Holders
98.56K
Source: Data from CoinMarketCap as of 31/07/2026. Figures may vary slightly across other tracking websites.
Immutable market outlook: Holder Growth and Token Unlock
Immutable's holder base has grown steadily over the past 30 days, moving from roughly 98.00K to 98.56K, with a noticeable step up around July 18 that has since held. 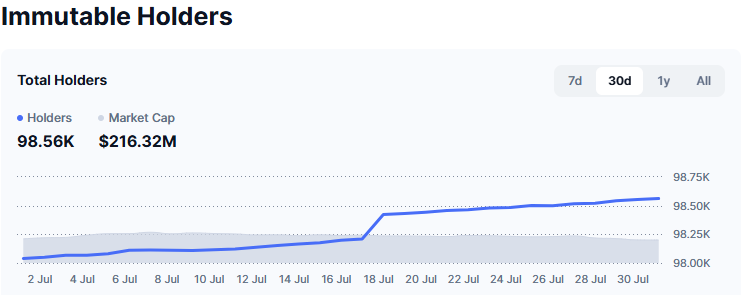
That growth has continued through the same window in which price has fallen, a divergence worth watching for this Immutable price prediction but not one this piece will assign a cause to since no confirmed driver has been announced.
On the supply side, Immutable's token unlock schedule is fully complete: 100% of the 2B IMX total supply is unlocked, with 0% locked and 0% untracked, per unlock-tracking data. That means there are no scheduled future unlock events. 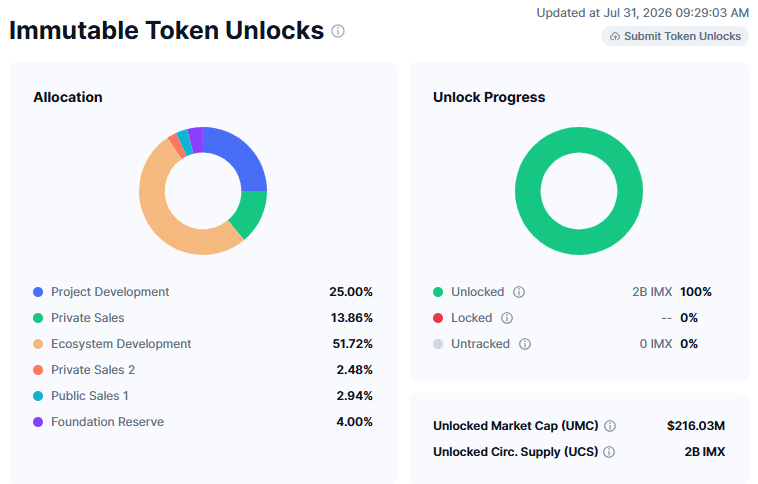
That could add fresh sell pressure to the market; any further downside would need to come from spot selling rather than new supply hitting the market.
Allocation Category
Share of Supply
Ecosystem Development
51.72%
Project Development
25.00%
Private Sales
13.86%
Foundation Reserve
4.00%
Public Sales 1
2.94%
Private Sales 2
2.48%
Immutable Prediction Chart: Short-Term Technical Analysis
Pair: IMX/USD · Market: Spot (Crypto) · Timeframe: 4H · Source: TradingView · Timestamp: July 31, 2026, 09:44 UTC+5:30
IMX trades at $0.10783. The broader structure shows price coming out of a sideways range near $0.125–$0.13000 in mid-to-late July before a sharp break.
followed by a small rising channel that has since rolled over again.
EMA 20 sits at $0.11218, and EMA 50 sits higher at $0.11780; both act as overhead resistance above the current price.
RSI (14), the 14-period Relative Strength Index that measures how overbought or oversold an asset is on a 0–100 scale, reads 24.06, deep in oversold territory below the 30 mark.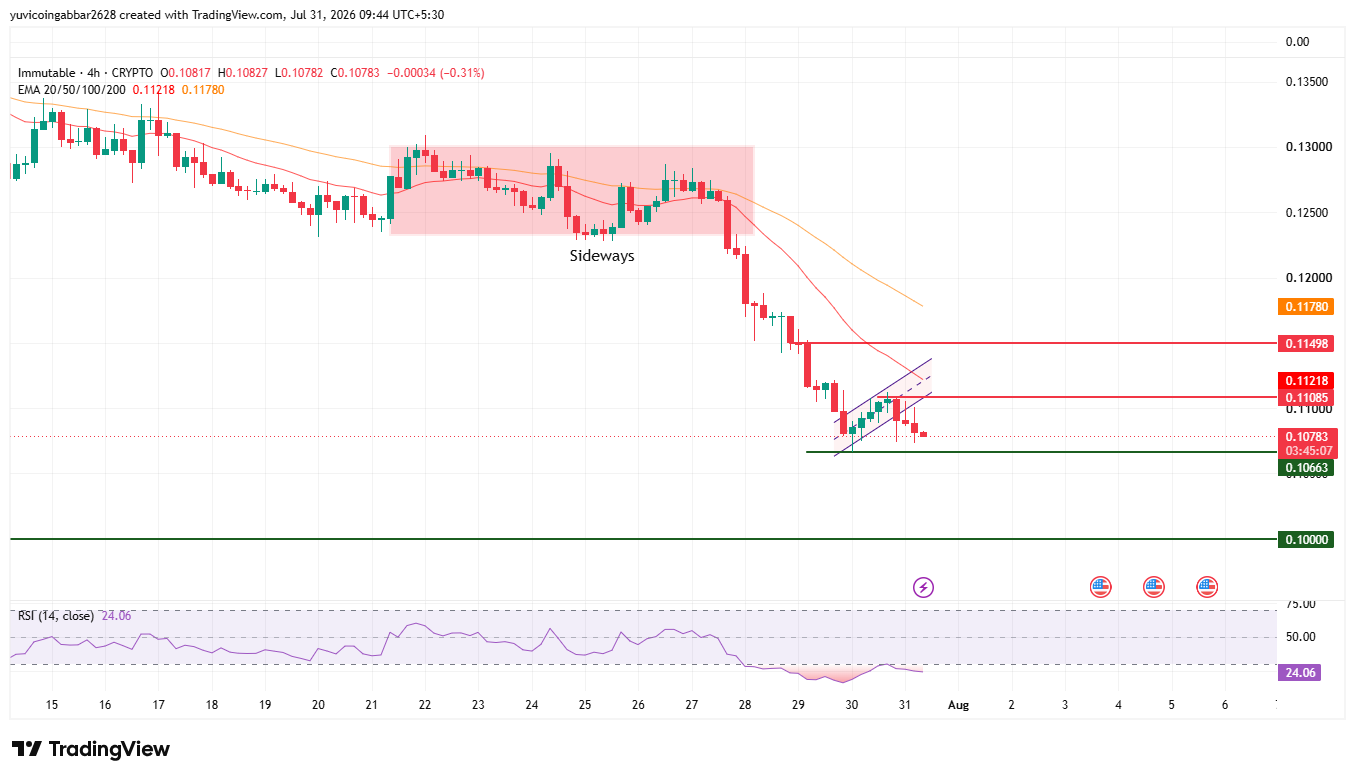
Level Type
Price
Resistance 2
$0.11498
Resistance 1 (EMA 20)
$0.11218
Initial Recovery Level
$0.11085
Immediate Price Reference
$0.10783
First Support
$0.10663
Deeper Support
$0.10000
IMX Forecast 2026: Long-Term Technical Analysis
Pair: IMX/USD · Market: Spot (Crypto) · Timeframe: 1D · Source: TradingView · Timestamp: July 31, 2026, 09:47 UTC+5:30
Zooming out to the daily chart, IMX has been in a steady downtrend since a high near $0.17 in late May, Price sits well below both the EMA 20 ($0.12179) and EMA 50 ($0.13089) on this timeframe, which shows how deep the multi-month decline has been.
RSI (14) reads 30.01, sitting right at the edge of oversold territory and broadly in line with the short-term reading.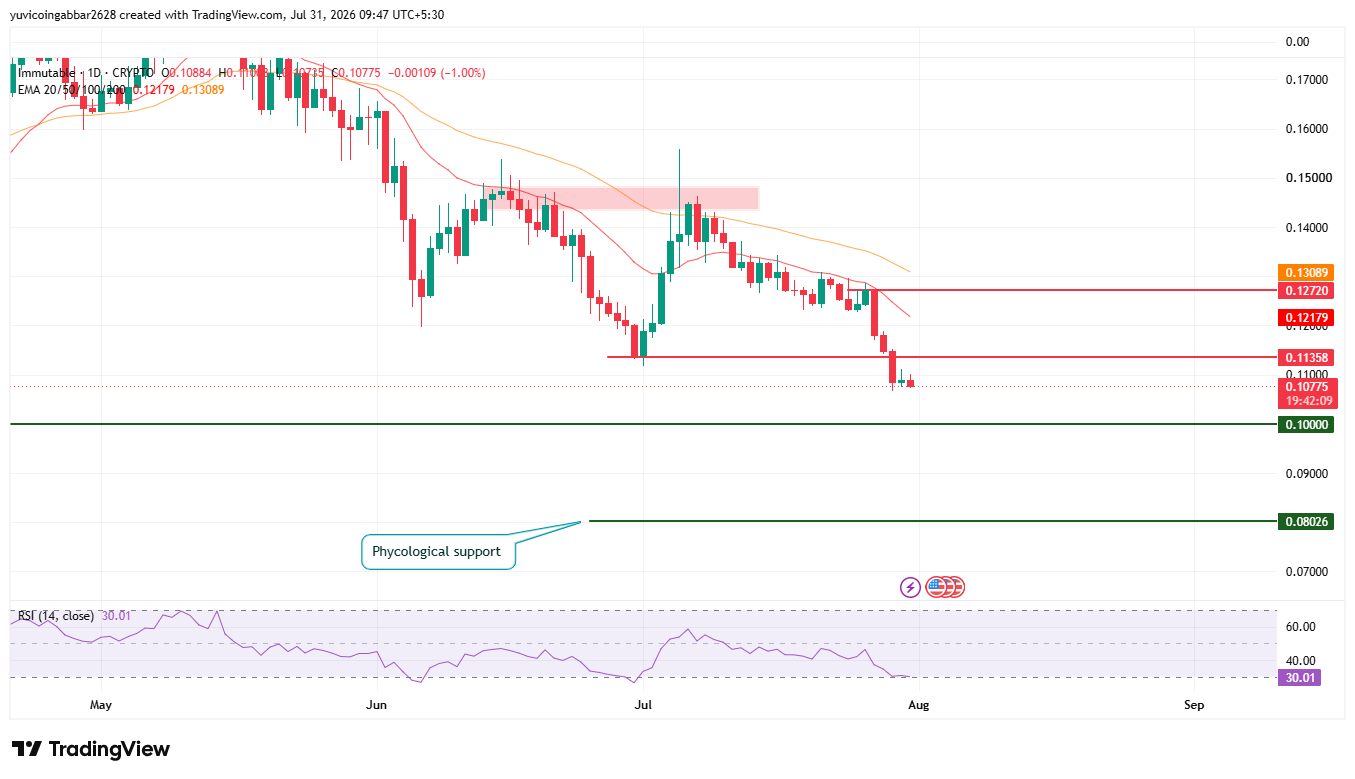
Level Type
Price
Resistance 2
$0.12720
Resistance (EMA 20)
$0.12179
Resistance 1
$0.11358
First Support
$0.10000
Deeper Psychological Support
$0.08026
Immutable Forecast August 2026: Bull Case vs. Bear Case
Bull case: If IMX holds above $0.10663 and reclaims the $0.11085–$0.11218 zone, the next level is $0.11498, with a longer-term stretch toward $0.1272 if the daily EMA 20 near $0.12179 gets cleared.
Deeply oversold RSI on the 4H chart adds some odds to a short-term bounce even within the larger downtrend.
Bear case: A confirmed close below $0.10000 on the daily chart would open a retest of the psychological level, and a failure to hold there could bring the deeper $0.08026 support into focus.
The steady rise in holder count through the recent decline offers a partial offset, but it hasn't yet reversed the broader daily structure.
Can IMX Reach the Immutable Price Target of $0.1272?
A move to $0.1272, the long-term resistance sitting just above the daily EMA 20 would require IMX to first reclaim its 4H resistance cluster near $0.11085–$0.11498 and then clear the daily EMA 20 at $0.12179.
That's a more ambitious stretch target than the base bullish case above and would likely need the oversold bounce to extend into a genuine trend shift on the daily timeframe rather than a short-lived relief rally.
What Could Invalidate the IMX Bullish Forecast?
A confirmed 4H close below $0.10663 would undercut the near-term recovery case, and a daily close under the $0.10000 psychological support would be the more significant signal, opening the path toward the $0.08026 level marked on the long-term chart.
Until $0.10000 is tested, the bearish scenario remains secondary to the base case.
IMX Short-Term Forecast: Risk-Reward at Current Levels
At the current price of $0.1081, the distance down to the deeper long-term support at $0.08026 works out to roughly 25.7%, while the distance up to the stretch resistance at $0.1272 works out to roughly 17.7%.
That puts the immediate risk-reward skew somewhat against fresh entries at this exact level, since the downside move to the next major support is larger in percentage terms than the upside move to the next major resistance, a gap that would need to narrow, likely through a bounce off $0.10663 or $0.10000, before the setup looks more balanced.
IMX Price Prediction Methodology
This forecast is built from multiple inputs rather than a single chart pattern: short and long-term market structure, the support and resistance levels drawn from both the 4H and daily charts, EMA and RSI momentum readings on each timeframe, the state of Immutable's token unlock schedule, and the broader trend context visible on the daily chart. No single data point is treated as decisive on its own.
Immutable Price Prediction August 2026: Expert View
According to CoinGabbar analysts, IMX's chart shows a clean downtrend on both timeframes, with RSI readings in oversold territory on the 4H chart and close to it on the daily, which typically raises the odds of at least a short-term bounce even within a larger downtrend.
The steady rise in holder count through the same decline is a separate signal worth tracking; it doesn't override the technical picture, but it does suggest new wallets are entering even as price falls.
With the token unlock schedule fully complete, any further downside pressure would need to come from existing holders selling rather than new supply entering circulation.
Data Sources
Price, market cap, supply, and holder data referenced from a CoinGecko-style tracker and holder-tracking dashboard, snapshot taken July 31, 2026, 09:29 IST. Token unlock allocation data referenced from an unlock-tracking dashboard, updated July 31, 2026, 09:29 AM. Chart analysis (EMA, RSI, support/resistance) sourced from 4H and 1D IMX/USD charts on TradingView, timestamped July 31, 2026, 09:44 and 09:47 UTC+5:30 respectively.
Disclaimer: This article is for informational purposes only and should not be treated as financial or investment advice. Crypto markets are highly volatile, and readers should do their own research before making any decisions.