The Asset Slips 12.8% as Trading Thins Near the Daily Low The Infi token trades near $0.09027 on Nov 20, 2026, down 12.8% in a day. CoinGecko lists $0.08762 as the 24h low and $0.1064 as the
The Asset Slips 12.8% as Trading Thins Near the Daily Low
The Infi token trades near $0.09027 on Nov 20, 2026, down 12.8% in a day. CoinGecko lists $0.08762 as the 24h low and $0.1064 as the 24h high.
This report reads the Gate four-hour chart for trend, turnover and levels. It then maps three paths through Dec 20, 2026.
Snapshot of the Nov 20 Market Data
The readings below come from CoinGecko and the Gate chart at 11:18 UTC on Nov 20.
Metric
Reading
Quote
$0.09027
24h change
-12.8%
24h range
$0.08762 to $0.1064
FDV
$9.033M
24h volume
$713,680
TVL
$72.102M
Total supply
100M
FDV, short for fully diluted valuation, multiplies the value of one unit by all 100 million units. TVL means total value locked, the funds users place in the protocol. CoinGecko lists no market cap or circulating figure.
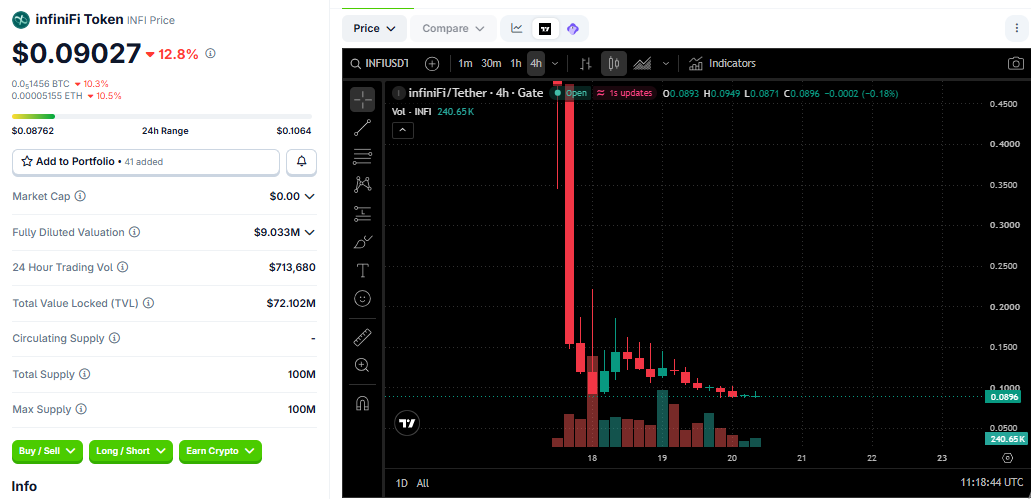
Source: CoinGecko Chart
Note: Prices can change quickly, so figures may not reflect the latest value. Readers should check a live price tracker for current data.
Infi Token Scorecard: Trend, Turnover and Valuation
Five readings shape the Infi token outlook for the next 30 days.
Signal
Reading on Nov 20
Lean
Trend
Lower swing highs on each daily stretch since launch
Bearish
Turnover
$713,680 traded, about 8% of FDV
Soft
Range position
Sits about 3% above the 24h low
Close to low
Valuation
FDV equals about 12.5% of TVL
Open question
Float
No circulating figure listed
Open question
The chart shows a tall red candle from launch. Every bounce after it topped out below the one before. Volume bars are also smaller on Nov 20 than on Nov 18 and 19.
For the Infi token, the first two rows carry the most weight here, because the chart and turnover have a clear daily record. Valuation and float stay open questions, since CoinGecko lists no market cap or circulating figure.
Price Ladder From Resistance to Support
The ladder below uses only levels from the data and the latest Gate candle.
Level
Value
Reference
Upper test
$0.1064
24h high
Round level
$0.10
Round number above the latest candle
Near test
$0.0949
Latest four-hour high
Gate close
$0.0896
Latest four-hour close
Support zone
$0.0871 to $0.0876
Latest four-hour low and 24h low
Round level
$0.08
Round number below support
The latest candle opened at $0.0893 and closed down 0.18%. A four-hour close below $0.0871 would leave $0.08 as the next reference.
Three Paths for the Infi Token Through Dec 20, 2026
Brackets show implied valuation, found by multiplying the quote by 100 million units.
Bear path, $0.06 to $0.08 (implied $6M to $8M, -34% to -11%): A close below $0.0871 on rising volume would show sellers returning.
Base path, $0.08 to $0.11 (implied $8M to $11M, -11% to +22%): The asset stays near the support zone and tests $0.10 without holding it. Volume stays thin.
Bull path, $0.12 to $0.16 (implied $12M to $16M, +33% to +77%): A close above $0.1064 would come first. Volume well above $713,680 would then be needed to test the $0.15 round level.
The paths cover about 30 days and overlap at their edges, so one reading can fit two of them. Each path needs a review when a four-hour candle ends outside its range.
Expert Opinion on Thin Turnover and Lower Highs
Turnover near 8% of FDV is modest for a new listing. Thin trading can let small orders move it. Lower highs also show sellers have met each bounce so far.
Falling volume can carry a second meaning. Selling pressure may be fading as holders finish exiting. The asset sits only 3% above the 24h low, so a hold at $0.0871 would change the pattern.
With no circulating figure listed, the tradable amount stays unclear. That limits how much weight the valuation reading can carry.
For the Infi token, volume returning before the move would be the cleaner signal. Every path here is a scenario, not a forecast of certain outcomes.
Conclusion: Levels and Signals to Follow Into December
The Infi token now sits close to support with weak turnover. A close below $0.0871 or above $0.1064 would likely set the next direction. Readers can follow official infiniFi channels and a live tracker for updates.
Disclaimer: This article is for information only and is not financial advice. Cryptocurrency assets are volatile and can lose value quickly. Price scenarios are estimates, not predictions of certain outcomes or guaranteed returns. Verify official announcements and contract details before making any financial decision.