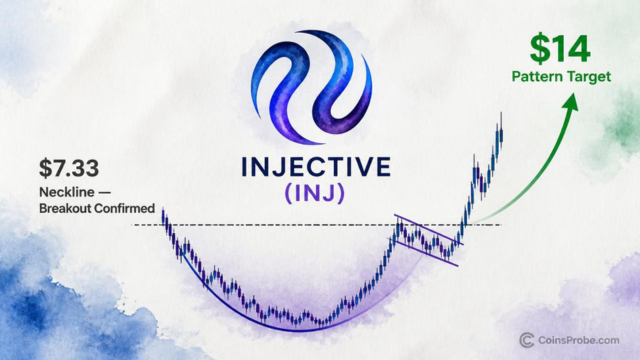
Key Highlights INJ is trading at $9.23 — already 30%+ above the $7.33 cup-and-handle breakout level per @alicharts Analyst Ali Martinez targets $13.86–$14.00 as the pattern's measured-move pr
Key Highlights
INJ is trading at $9.23 — already 30%+ above the $7.33 cup-and-handle breakout level per @alicharts
Analyst Ali Martinez targets $13.86–$14.00 as the pattern's measured-move projection — ~52% above current price
$7.33 neckline is the invalidation level; loss of it on a weekly close ends the bullish thesis
$10.35 is the first intermediate resistance between current price and the $14 target zone
Injective (INJ) is trading at approximately $9.23 — already more than 30% above its breakout level — and analyst Ali Martinez (@alicharts) says the move is not over. The cup-and-handle formation that triggered the surge is a measured-move pattern, and its projected target sits near $14 — roughly 52% above the current price at the time of writing.
Martinez flagged the setup in a thread post on October 5, 2026, identifying a neckline at $7.33 and a pattern target of $13.40. On October 16, he updated the call: the breakout had already delivered more than 30% from that $7.33 level, but the pattern’s full measured move remains unresolved. His verdict: “The rally has just begun.”
A cup-and-handle is a continuation pattern. The “cup” is a rounded bottom formed after a sustained decline — price grinds lower, rounds out, and recovers to approximately the original high. The “handle” is a shallow consolidation near that high, representing final distribution before a breakout. When price closes above the neckline (the resistance formed at the cup’s rim), the pattern triggers. The measured-move target is calculated by adding the depth of the cup to the breakout level.
In INJ’s case, the chart shared by @alicharts shows a deep rounded trough spanning approximately March through September 2026, with price finding its low around $4.02 before recovering toward the $7.33 neckline. The handle formed as a tight consolidation just below that level. The breakout above $7.33 confirmed the pattern — and Martinez’s October 5 note put the pattern target at $13.40. His October 16 update revised the rounded figure to “near $14,” consistent with the chart annotation showing $13.86 as the projected level.
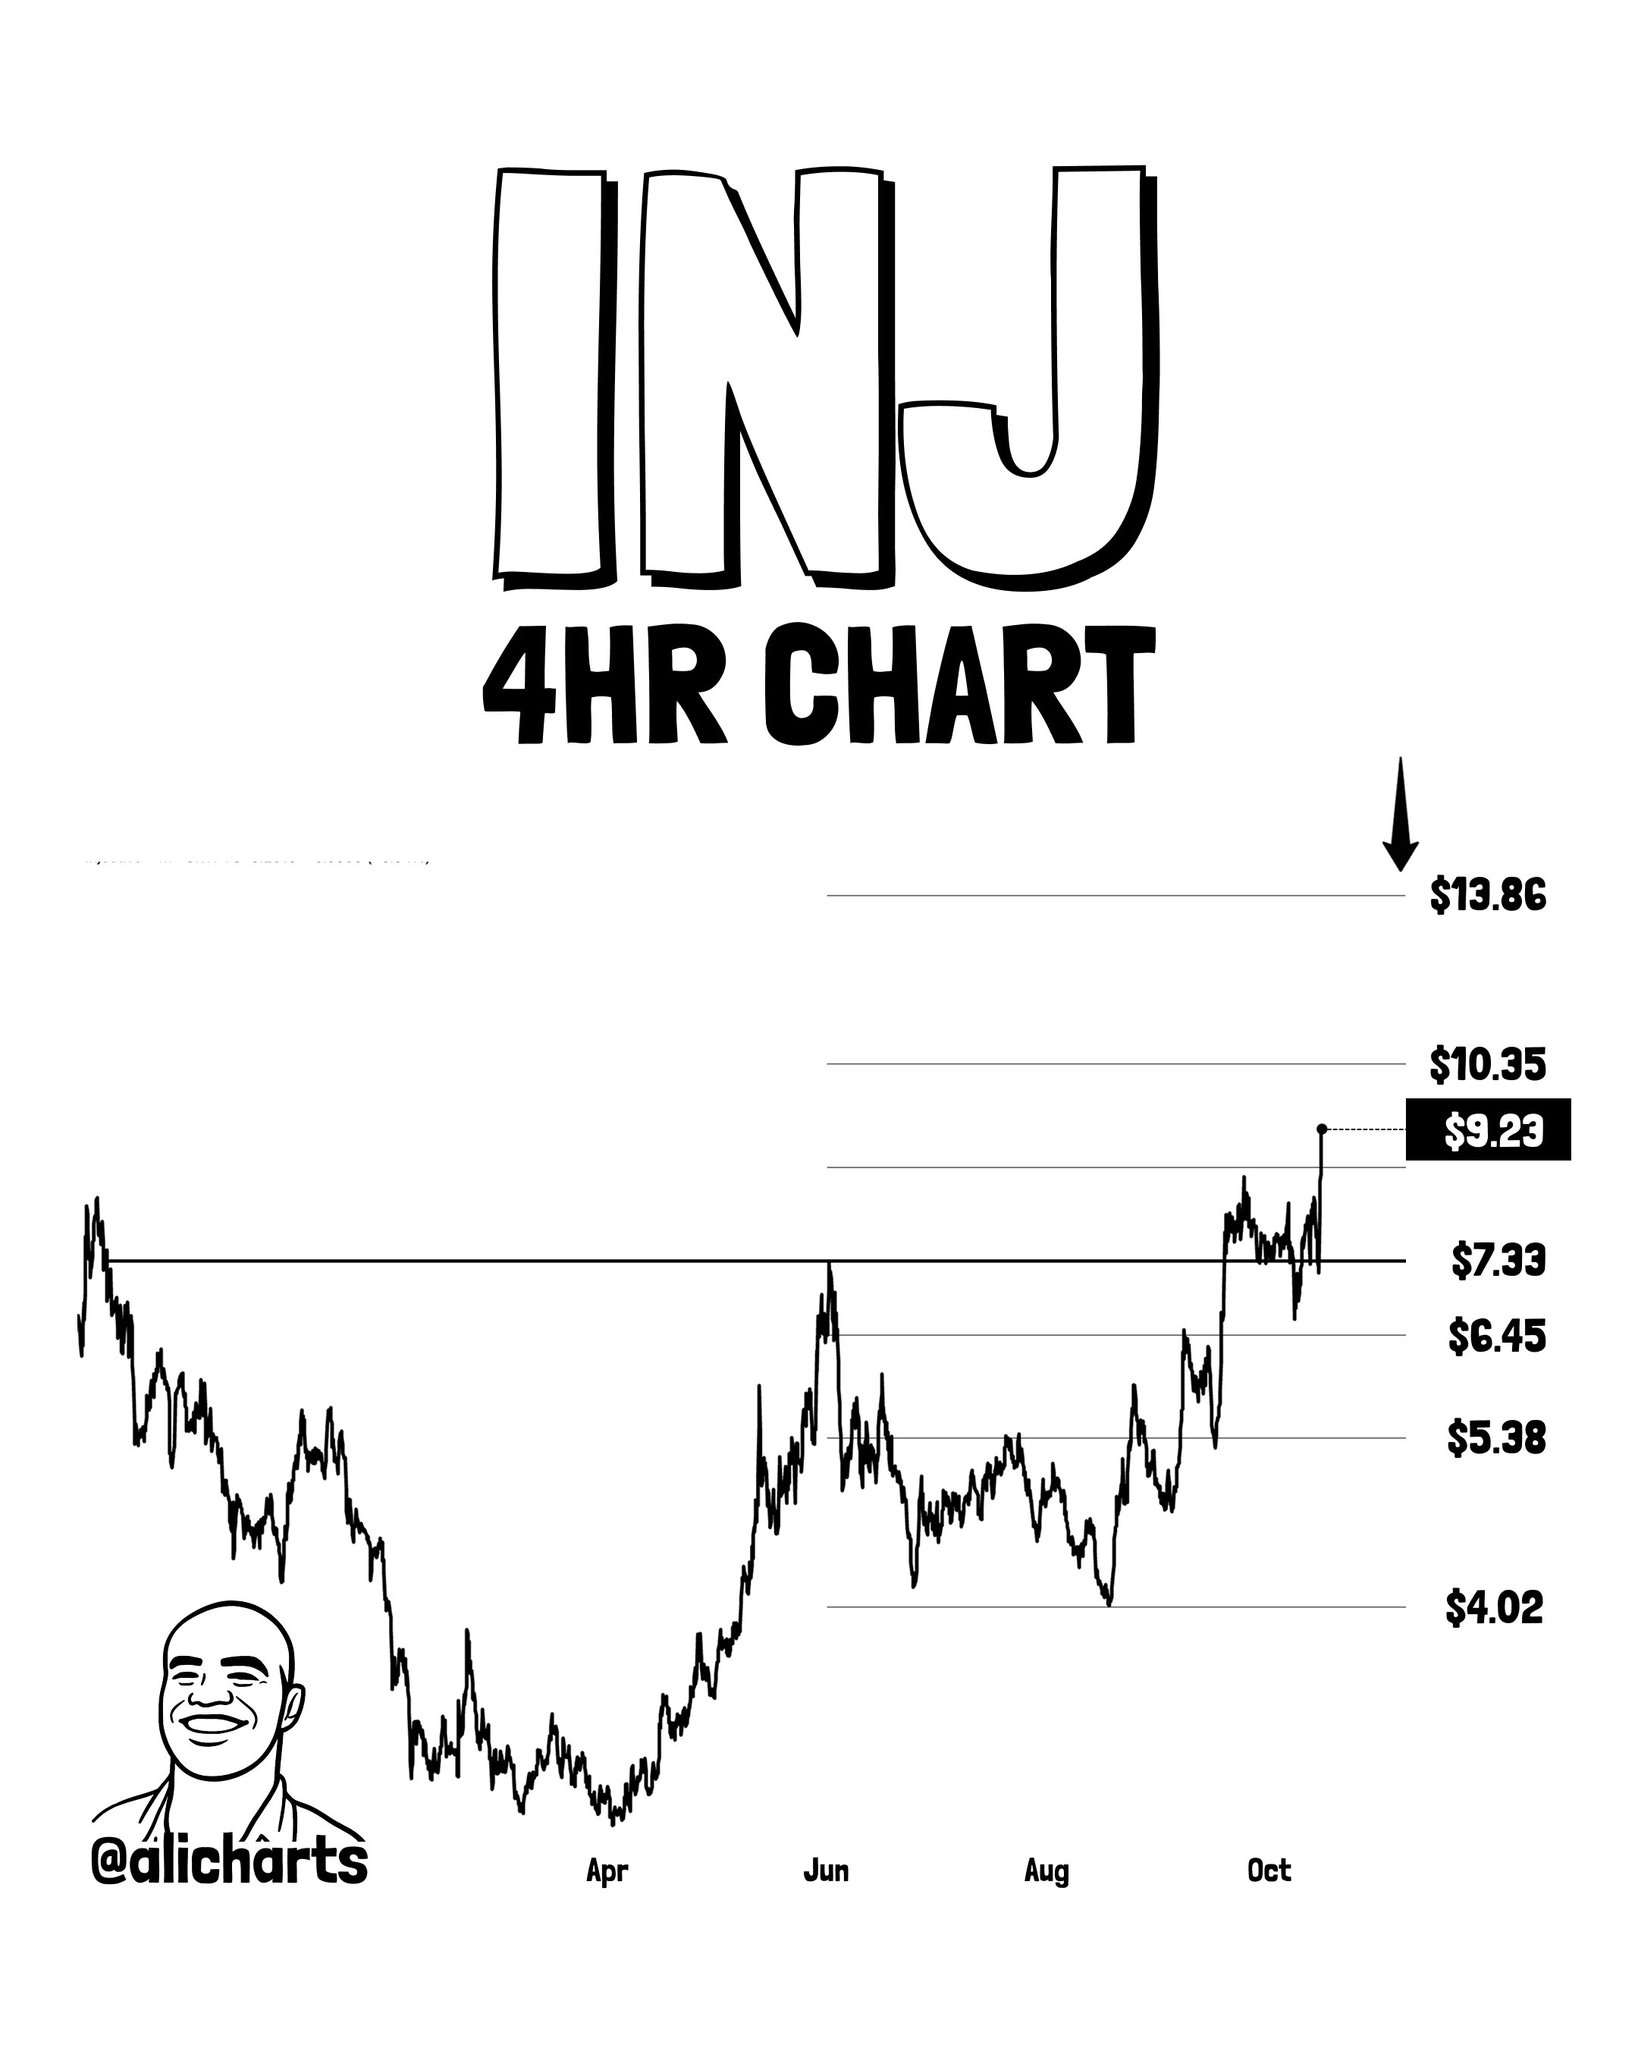
INJ 4HR Chart Analysis | Source: @alicharts (X)
At a current price of $9.23, INJ has cleared the breakout zone decisively. The key intermediate levels visible on the chart — $10.35 and $13.86 — represent the next structural tests between current price and the pattern’s completion zone. The chart’s lower reference levels ($6.45, $5.38, $4.02) mark the depths of the cup that defined the pattern’s scale.
Martinez’s data is precise on one point: INJ has already surged more than 30% from the $7.33 breakout level. That tracks with the current price of $9.23 — a gain of approximately 26% from $7.33 at the time of the chart, consistent with the “more than 30%” figure given intraday movement. The pattern target near $14 represents an additional ~52% from $9.23, and approximately 91% from the original $7.33 breakout point.
This is the structural logic of measured-move patterns: the first 30% of a cup-and-handle breakout is often the easiest, as it clears overhead supply built during the handle. The remaining move, from mid-cup to target, tends to involve retests of prior resistance-turned-support — in this case, the $7.33 neckline becoming a floor on any pullback.
For context on broader altcoin technical setups forming simultaneously, see XRP, SOL, DOGE, HYPE Flash TD Sequential Buy Signals — Analyst Watches $1.40.
In cup-and-handle analysis, the neckline serves two functions after a confirmed breakout: it becomes the primary support on any pullback, and its defense determines whether the pattern remains valid. Martinez identified $7.33 as the neckline explicitly in his October 5 thread. A sustained weekly close back below $7.33 would undermine the formation’s integrity — signaling that the breakout was a failed attempt rather than a confirmed launch.
The chart labels a price near $9.23 as the current level, with $10.35 as the next printed resistance above. Between $9.23 and the $13.86–$14.00 target zone, the $10.35 level is the first meaningful test. A clean weekly close above $10.35 would reduce the probability of a neckline retest and strengthen the case for pattern completion near $14.
Bullish Scenario
INJ holds above the $7.33 neckline on any pullback, clears $10.35 on weekly close, and tracks toward the $13.86–$14.00 measured-move target — a further ~52% from the $9.23 level at time of writing. This outcome is consistent with Martinez’s declared target and the pattern’s structural mathematics.
Bearish Scenario
A sustained close back below $7.33 invalidates the cup-and-handle breakout. Pattern failure at this stage would expose the $6.45 and $5.38 levels visible on the chart, representing 30%–42% downside from current price. Martinez’s October 5 note framed neckline defense as the condition for the bullish thesis — loss of $7.33 removes that condition.
Martinez’s October 16 update is declarative, not hedged: “The rally has just begun.” The mechanism behind that confidence is the pattern’s unresolved measured move. Cup-and-handle formations are not momentum indicators — they are geometric price targets derived from the depth and width of the structure. At $9.23, INJ sits roughly halfway between its breakout point ($7.33) and its pattern target ($13.86–$14.00). The first half of the move is confirmed. The second half is the thesis.
The macro backdrop for altcoin technical setups is explored in Bitcoin Tests $80.4K Support as October Lags History — The Line in the Sand — Bitcoin’s own structure will influence whether altcoin patterns like INJ’s can complete without macro interference.
The $7.33 neckline is the number that keeps the setup intact. The $13.86–$14.00 zone is where the pattern completes. Every session between those two levels is part of the same formation. Watch $10.35 as the first intermediate confirmation, and $7.33 as the invalidation that ends the thesis.
Disclaimer: The views and analysis presented in this article are for informational purposes only and reflect the author’s perspective, not financial advice. Technical patterns and indicators discussed are subject to market volatility and may or may not yield anticipated results. Investors are advised to exercise caution, conduct independent research, and make decisions aligned with their individual risk tolerance.
Also Read: Bitcoin Tests $80.4K Support as October Lags History — The Line in the Sand.