INJ trades near a major support zone as buyers continue defending demand after months of selling pressure. Funding rates remain near neutral, showing balanced leverage despite recent price re
- INJ trades near a major support zone as buyers continue defending demand after months of selling pressure.
- Funding rates remain near neutral, showing balanced leverage despite recent price recovery efforts.
- A move above nearby resistance could strengthen recovery momentum, while support remains critical.
INJ price remains at a critical technical level after an extended decline, with traders closely watching whether support can sustain recent stabilization and create conditions for a short-term recovery.
INJ Price Tests Major Support Following Extended Pullback
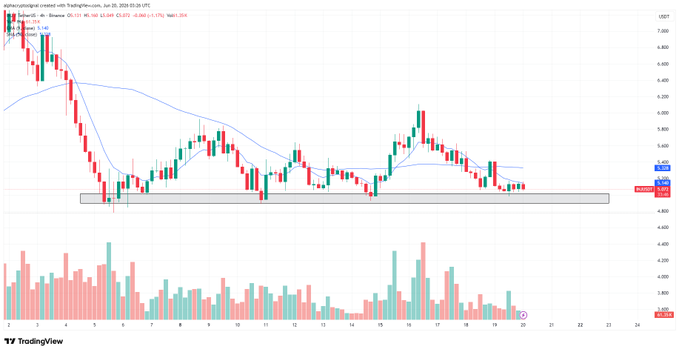
Alpha Crypto Signal recently noted that INJ returned to a key horizontal support area. The asset has spent weeks correcting after a prolonged bearish phase. Current trading activity shows buyers defending an important demand zone.
Source:
XPrice action indicates that selling pressure has slowed near support. However, the broader trend remains cautious as major moving averages stay overhead. Those levels continue acting as resistance across short-term timeframes.
The latest market data places INJ near $5.12. During the past 24 hours, the token traded within a relatively narrow range. The action suggests a consolidation, not aggressive directional play.
Market participants continue monitoring support around the $5.00 region. Earlier selling briefly pushed the price below that level before buyers responded. The rebound helped restore stability near the lower boundary of the range.
Resistance Levels Continue to Shape Near-Term Market Structure
The chart shared by Alpha Crypto Signal shows repeated support tests. Each bounce attracted demand, preventing a decisive breakdown. At the same time, recovery attempts have remained limited.
Price repeatedly approached the $5.10-$5.15 resistance area. Sellers emerged during those advances and restricted upside progress. As a result, the market remains trapped between support and resistance.

Moving averages reinforce the current technical picture. Both shorter and longer-term averages remain above price action. This positioning suggests trend control has not yet shifted to buyers.
Trading volume adds another dimension to the analysis. 24-hour volume declined while price posted modest gains. Lower participation often reflects caution among market participants awaiting confirmation.
Funding Data Signals Balanced Positioning Despite Recovery Efforts
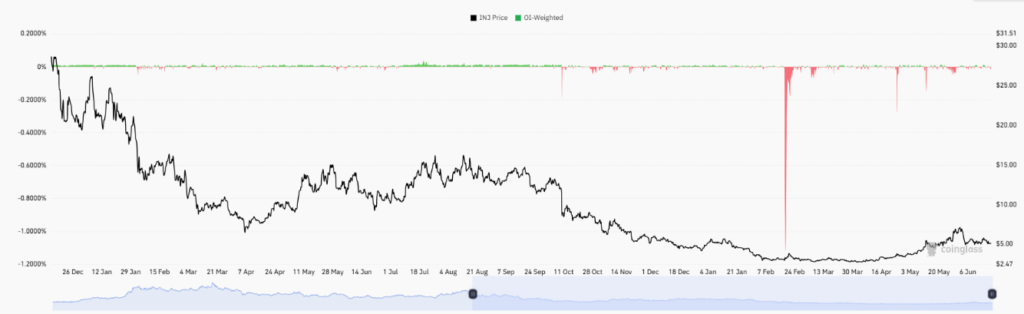
The OI-weighted funding rate chart provides additional context for INJ. During the broader decline from late December through April, funding rates stayed close to neutral. This pattern suggested limited leverage dominance from either side.
Source:
CoinglassOne notable exception occurred during late February. Funding rates recorded a sharp negative spike as bearish positioning intensified. Such events often reflect periods of elevated market stress.
Following that episode, INJ continued trading near cycle lows before stabilizing. Recovery gradually emerged during April and May as price climbed from the $3 to $4 area. The advance developed without excessive leverage entering the market.
As of writing, funding rates remain close to zero. That balance indicates relative equilibrium between long and short positions. With support still holding and leverage controlled, traders now focus on whether resistance can be reclaimed or support eventually fails.