Can a Nasdaq-linked staking product and a near-unanimous upgrade vote stop INJ from sliding further? Sellers aren't convinced yet. INJ dropped 11.28% in a day to $7.097, and thelatest crypto
Can a Nasdaq-linked staking product and a near-unanimous upgrade vote stop INJ from sliding further?
Sellers aren't convinced yet. INJ dropped 11.28% in a day to $7.097, and thelatest crypto price predictions keep pointing back to $6.560.
This Injective price prediction leans bearish below $7.675, even with a bounce already underway.
Injective Price Prediction Starts With the Data
INJ trades at $7.097 inside a 24-hour range of $6.557 to $8.246.
Volume, the amount of coins changing hands, hit $70.11M on spot markets, up 22.67%.
Injective data on CoinMarketCap puts the market cap at $709.02M, rank 70th, with a wider volume count of $203.09M.
Price sits about 86.5% under its $52.75 all-time high.
Nasdaq, MiCA and Veyra Add a Real Catalyst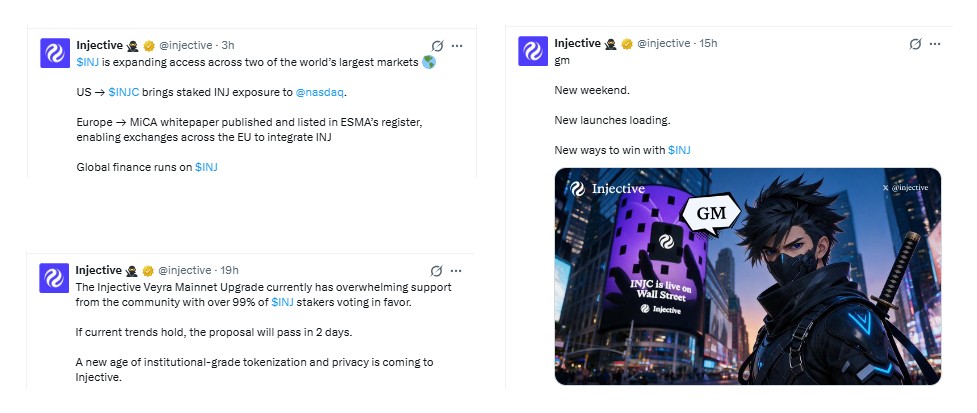
Injective'sMiCA and Nasdaq posts lead three official X posts. INJC brings staked INJ exposure to Nasdaq in the US.
In Europe, a MiCA whitepaper (the EU's crypto rulebook) now sits in ESMA's register, so exchanges across the EU can integrate INJ.
Over 99% of stakers back the Veyra upgrade, and it passes in 2 days if that holds.
Veyra seems a clean bullish trigger. Then again, a passed vote isn't a live product, and sellers dumped INJ anyway.
But the price ignored every post.
INJ Price Analysis From Breakout to Breakdown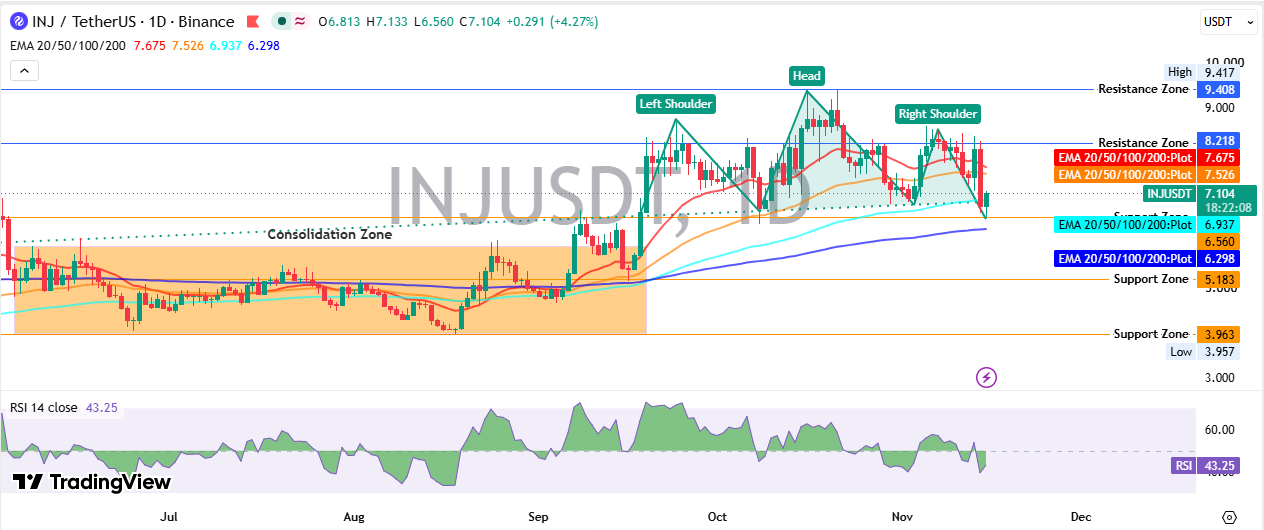
Consolidation and a Triple Peak
INJ moved sideways for roughly 2 months, with floors at $3.957 and $5.183. A sharp breakout then lifted the price above every moving average.
On the TradingView INJUSDT chart, a left shoulder is topped above $8.2.
The head hit $9.417 at resistance, a level where sellers have stepped in before, and got turned back near $9.408.
And the right shoulder failed at $8.218, a lower high. Together they form a head and shoulders pattern, a topping shape with the middle peak highest.
Neckline Break and the Bounce
The neckline, a line joining the lows between those peaks, runs near the 100 EMA (an exponential moving average that weights recent prices more) at $6.937.
Sellers broke through it and hit $6.560 support, a level where buyers stepped in before.
Today's daily candle opened at $6.813, dipped to $6.560 and traded at $7.104, up 4.27%.
That's a weak bounce. One that's still retesting the broken neckline from below.
And a retest that fails is how this pattern confirms.
Exponential Moving Averages and RSI
Price trades under the 20 EMA at $7.675 and the 50-day at $7.526. It holds above the 100 EMA at $6.937 and the 200 EMA at $6.298, which keeps this INJ price analysis from turning fully negative.
RSI, a 0 to 100 gauge of buying versus selling speed, sits at 43.25. Under 50, meaning sellers lead.
But 30 is where oversold starts, so the drop has room left.
What happens if RSI can't reclaim 50 while price stays under $7.526?
Futures Data Leans Short
Open interest, the total value of open futures contracts, fell 15.39% to $132.70M.
The funding rate, a fee for long and short swaps to keep futures near spot price, turned negative at -0.0116%. Shorts paying longs, in other words.
Liquidations, forced position exits, a hit of $2.13M onCoinGlass INJ data, and 82% were longs.
Futures volume of 513.51Mrunsabout7timesspot.Andnetoutflowssitat-4.4M on spot and -$17.9M on futures.
Solana INJ Holders Sit in Few Wallets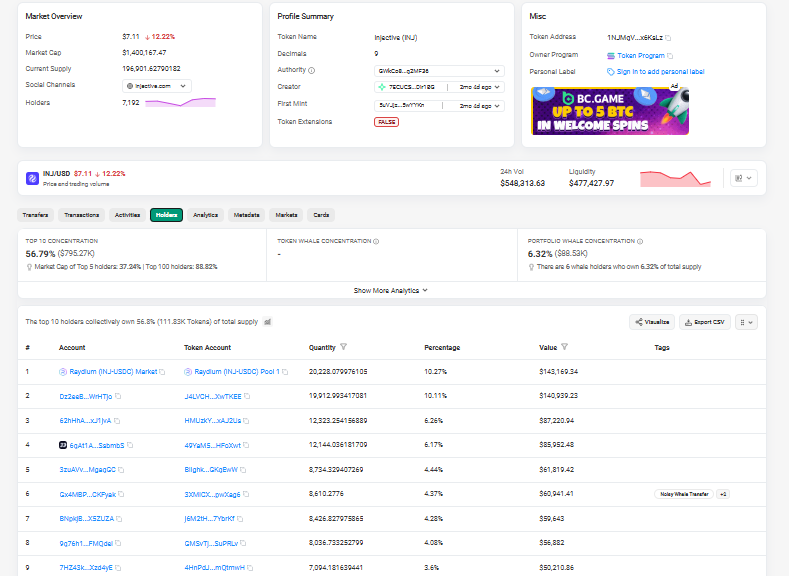
The Solana token trades at $7.11, down 12.22%, with a market cap near $1.40M.
The top 10 holders own 56.79% of supply, perSolscan holder data, and the Raydium INJ-USDC pool alone holds 10.27%.
Pool liquidity is only $477,427.97. But a few wallets can swing that price alone.
Injective Price Prediction Scenarios and Targets
This Injective price prediction rests on 4 levels: $7.675, $6.937, $6.560 and $6.298.
Bearish Case Below $6.560
Bearish is the call below $7.675.
A daily candle trading under $6.560 confirms the neckline break and opens at $6.298, the 200 EMA. Under that, $5.183 is next, and $3.963 is the last chart support.
Base Case Inside the Range
Chop between $6.560 and $7.526 fits the base case. Sellers cap bounces at the 50 EMA.
Bullish Injective Price Prediction Needs $7.675
Reclaiming $7.675 on rising volume flips the 20 EMA to support. The Injective price forecast then opens at $8.218, the right shoulder high, and $9.408 after that.
Anyone tracking the ETF angle can read thisINJ ETF rally outlook.
Scenario Table
European exchange integrations matter for liquidity, soexchange listing updates deserve a watch.
Scenario
Trigger
Target
Invalidation
Liquidity Condition
Bearish
Daily candle under $6.560
$6.298, then $5.183
Trades above $7.675
Spot outflows, thin bids
Base
Holds $6.560 to $7.526
Range trade
Break of either edge
Spot volume near $70.11M
Bullish
Reclaims $7.675 on volume
$8.218, then $9.408
Falls under $6.937
Spot inflows turn positive
What Could Flip the INJ Price Outlook
Veyra passing in 2 days is the first test. Spot net flows moving from -$4.4M to positive would back it.
The $INJ price outlook turns neutral above $7.675 and bullish above $8.218. For background, see thisearlier INJ breakout forecast.
Risks Still on the Board
Fear and greed sit at 11, extreme fear, so altcoins are getting sold first.Meme coin market news shows whether risk appetite is changing.
And a failed Veyra rollout would hand sellers a reason to target $5.183.
Final Takeaway
In the short term, this Injective price prediction stays bearish until $7.675 is reclaimed. The $INJ price projection puts $6.298 first.
$INJ also carries an AI and big data tag on CoinMarketCap, soAI crypto news is worth tracking.
Disclaimer: This article is for information only and isn't financial advice. Crypto prices swing fast, and readers should do their own research before making any trade.