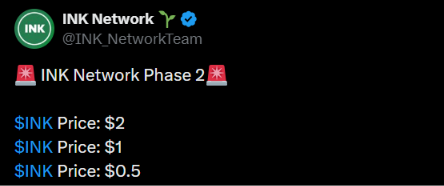
INK Network News: What Do the Three Phase 2 Levels Mean? The latest INK network news comes from a short post on October 17, 2026. It carried a Phase 2 label and three dollar figures: $2, $1,
INK Network News: What Do the Three Phase 2 Levels Mean?
The latest INK network news comes from a short post on October 17, 2026. It carried a Phase 2 label and three dollar figures: $2, $1, and $0.5.
The post gave no date and no explanation, so the numbers are best treated as talking points rather than confirmed plans.
What the post leaves out:
No launch or final date for Phase 2
No explanation of whether the figures are targets, tiers, or forecasts
No mention of supply changes or a listing plan
Source:Official X Post
How Far Are Those Levels From Today’s Trading Rate?
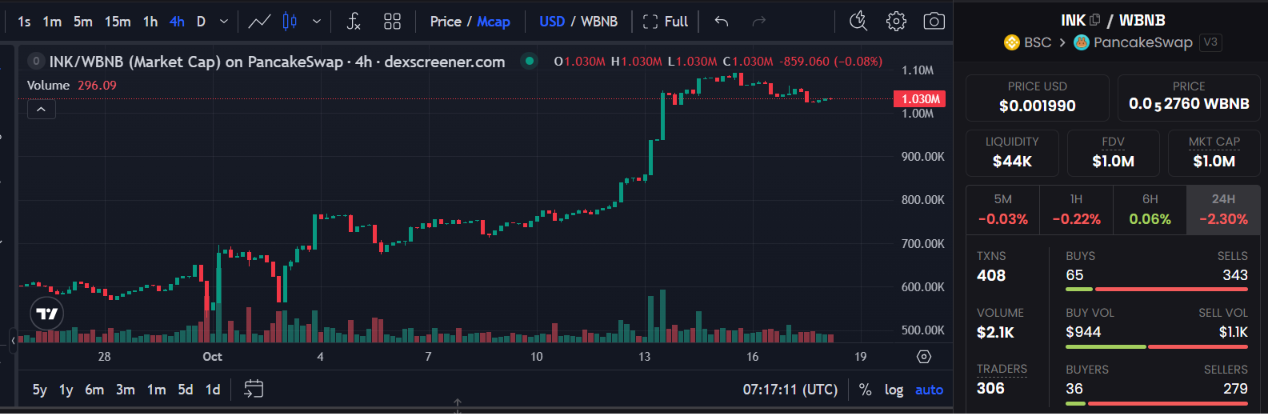
A key point in INK network news is the gap between the posted levels and live trading. The token traded near $0.00199 on October 18, 2026 in its WBNB pair. Measured against that rate, each level sits far away:
Posted level
Multiple of the current rate
Rough implied FDV
$2
about 1,005x
about $1.0 billion
$1
about 503x
about $503 million
$0.5
about 251x
about $251 million
The implied values scale the roughly $1.0 million fully diluted value seen today, so they are rough estimates, not forecasts.
Note: Prices can change quickly, so figures may not reflect the latest value. Readers should check a live price tracker for current data.
Why Trading Activity Looks One-Sided
Sellers dominated the latest 24 hours. Sells outnumbered buys by about five to one, even though the daily move stayed modest at -2.30%. Total volume was only about $2.1K.
Metric
Reading
Transactions
408
Buys
65
Sells
343
Buy volume
$944
Sell volume
$1.1K
Liquidity and Market Cap: How Thin Is the Pool?
The pool holds about $44K in liquidity against a market cap near $1.0M. That is roughly 4.4% of the total value, which is shallow. In crypto trading, shallow pools can let a handful of orders move the rate sharply in either direction.
Reaching any posted level would need far deeper liquidity and steady buying, which current data does not show.
Source: Dex Screener Chart
Market Cap Climb Since Late September
The chart behind this INK network news item tells a different story from today’s sell-heavy flow. Market cap sat near $500K to $600K in late September, jumped sharply around October 13, and peaked near $1.1M before easing.
Late September: roughly $500K to $600K
Mid-October peak: about $1.1M
Latest reading: about $1.03M
The climb shows earlier interest, yet the recent easing and heavy selling suggest momentum has cooled.
Why Unexplained Targets Carry Little Weight
Round-number targets spread easily on social media, yet they say nothing about supply, demand, or timing. Traders usually want a schedule and clear token mechanics before treating a figure as meaningful.
What to Watch Next as Phase 2 Details Emerge
For anyone following crypto news today, the useful checkpoints are concrete:
An official Phase 2 date
Clarity on what $2, $1, and $0.5 refer to
Growth in liquidity and buy volume
Any confirmed listing announcement
Readers following INK network news should separate community posts from confirmed announcements. Posted levels with no supporting details remain speculation, and the crypto market can shift quickly.
YMYL Disclaimer: This article is for information only and is not financial advice. Crypto assets are volatile, and price levels without confirmed details are speculative. Readers should do their own research before making any decision.