What does a token do after jumping 201% in one day and then slipping on the hourly chart? That's the puzzle at 06:51 UTC on October 24, 2026, and this IRYS price prediction works from live nu
What does a token do after jumping 201% in one day and then slipping on the hourly chart?
That's the puzzle at 06:51 UTC on October 24, 2026, and this IRYS price prediction works from live numbers, with the token near $0.08166 after a week that fills every list ofcrypto price predictions.
But a move this fast rarely ends quietly, and the next few trading sessions decide whether the IRYS token builds a base or hands the gains back.
IRYS Price Market Data Snapshot
Metric
Value
Price
$0.08166
Market cap
$163.037M
Fully diluted valuation
$815.184M
24-hour trading volume
$708.877M
All-time high
$0.2959
All-time low
$0.01172
Perpetual futures open interest
$856.849M
Circulating supply
2B
Source: Data taken from CoinGecko
Fully diluted valuation, the value if all 10B tokens were already out, sits at $815.184M against a $163.037M market cap, because only 2B coins circulate today. That gap matters.
Longer timeframes read like a rocket launch, with IRYS crypto up 531.63% over 7 days, 436.01% over 30 days, and 526.10% over 90 days.
The 4-hour change fell 19.60%. Which, after a 201.57% day, hardly counts as a surprise.
Profit-taking usually arrives fast once gains stack this high, a pattern that keeps repeating acrossaltcoin market updates.
And the one-year return of 472.55% matches the all-time figure, so the whole trading history fits inside twelve months.
IRYS Price Breaks All-Time High Before Pulling Back
Within the 24 hours to 06:51 UTC, the IRYS token broke its all-time high, the highest price ever recorded, printing $0.2959 before sellers took over, and the price now sits about 72% below that peak.
The 7-day range runs from $0.01172 to $0.2959, and the price still trades nearly 600% above the all-time low.
IRYS Token Whale Wallets on Etherscan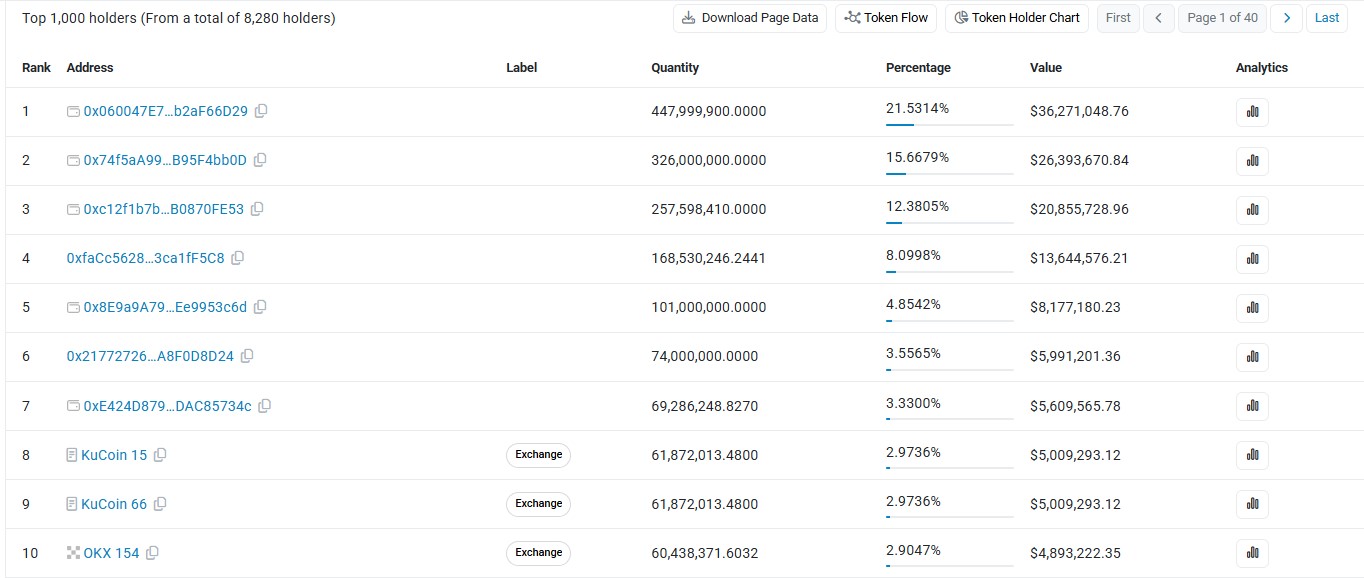
Etherscan holder list shows 8,280 holders in total, with the largest wallet owning 447,999,900 tokens, or 21.5314% of supply, worth about $36.27M.
The next two wallets hold 15.6679% and 12.3805%, so just three addresses control nearly half the supply at 49.58% combined.
And exchange wallets matter too, with KuCoin 15 and KuCoin 66 each at 2.9736% and OKX 154 at 2.9047%, tokens that can hit order books fast if sellers appear.
IRYS Liquidation Data After the Short Squeeze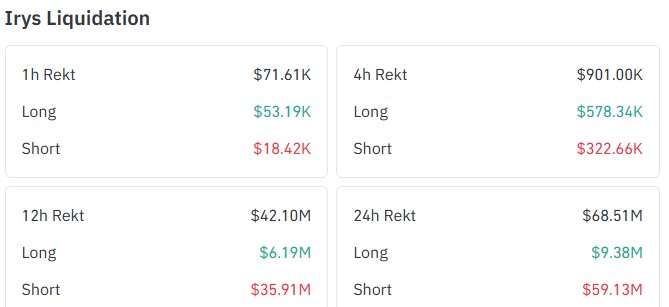
Liquidation means an exchange ends a trade by force when a trader can't cover the losses, and freshCoinGlass liquidation data shows plenty of it. Shorts got crushed.
Traders betting on a price drop lost $59.13M in 24 hours, while longs, the traders betting on a rise, lost just $9.38M, which pushed total IRYS liquidation to $68.51M.
In the last 4 hours, longs lost $578.34K and shorts lost $322.66K, and the latest hour shows the same story, with $53.19K lost by longs and $18.42K by shorts. That short squeeze, where losing sellers are forced to buy and push the price up, has run out of steam, and now buyers are the ones losing money.
IRYS Crypto Futures Volume and Open Interest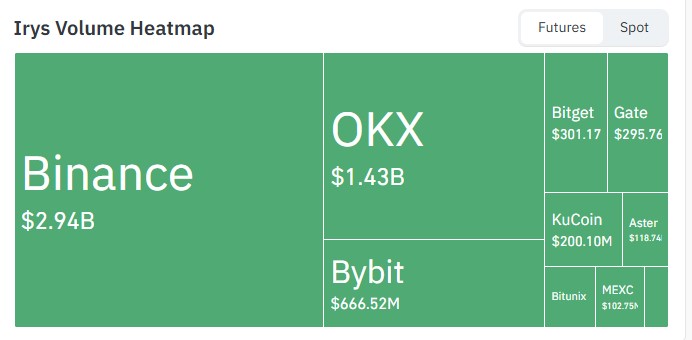
Open interest, the total value of futures bets still active, stands at $856.849M, more than five times the $163.037M market cap, and thisopen interest explained guide shows why such a gap can magnify every swing.
With that much money riding on futures, who's really setting the price?
The futures volume heatmap puts Binance first at $2.94B, with OKX at $1.43B and Bybit at $666.52M.
IRYS Price Prediction: 1-Hour Chart Analysis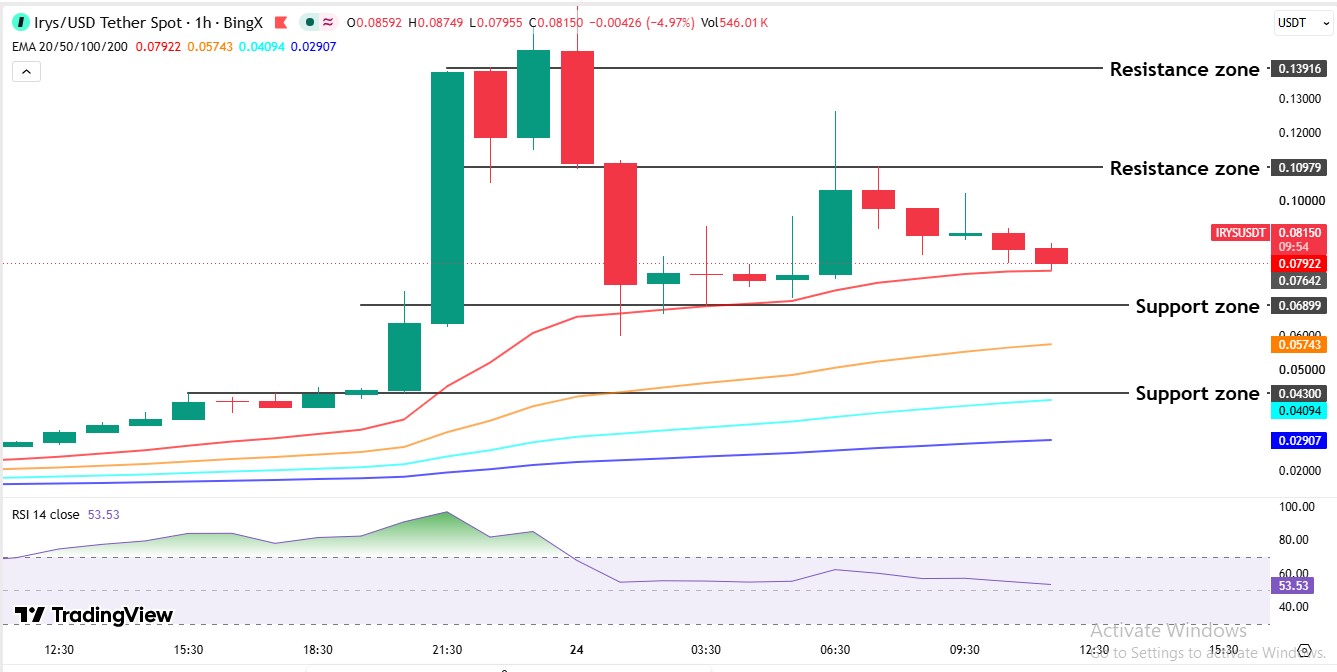
This IRYS technical analysis uses the 1-hour IRYS/USDT chart, where the latest candle trades at $0.08166. The story starts with a quiet stretch, as the price moved sideways near $0.04300 for hours.
Then buyers broke out. Two big green candles pushed the price toward $0.13916 and achieved the new all-time high of 0.2959, and the RSI jumped above 90. That rally wiped out all shorts, traders betting on a drop, with $59.13M lost to liquidation in 24 hours.
After the peak, the move flipped. One big red candle erased most of the gain in one hour, the price found support near $0.06899, and a later green candle shot above $0.10979 but left a thin top line that shows sellers pushed the price back down. That drop started hitting longs.
Now the price sits just above the 20 EMA, a line that shows the average of recent trades, at $0.07922, and the RSI has cooled to 53.53. The 50 EMA, 100 EMA, and 200-period EMA lines at $0.05743, $0.04094, and $0.02907 still sit below.
IRYS Support and Resistance Levels
Zone
Level
Role
Resistance 2
$0.13916
Major supply zone
Resistance 1
$0.10979
Recent rejection
Support 1
$0.06899
Range base
Support 2
$0.04300
Earlier breakout base
IRYS Bull, Base, and Bear Scenarios
Three paths stand out for this IRYS price prediction, and each depends on whether buyers can defend $0.06899 and reclaim $0.10979 while thelatest crypto news keeps sentiment moving.
Scenario
Trigger
Target zone
Bull case
Trades above $0.10979
$0.13916
Base case
Range holds above $0.06899
$0.06899 to $0.10979
Bear case
Trades below $0.06899
$0.05743, then $0.04300
The bear path deserves the most weight right now, since momentum has turned lower, whales hold nearly everything, and longs are the ones getting liquidated.
IRYS Price Forecast: Expert Outlook
For the short term, the IRYS price prediction leans bearish. Mostly because a 201.57% day, 99.90% top-100 concentration, and flipping liquidations rarely produce a clean trend.
EarlierIRYS airdrop coverage adds context, and with 8B tokens not yet circulating, supply risk hasn't gone away.
A hold above $0.06899 keeps a base alive, and a push past $0.10979 reopens $0.13916. Until then, caution beats chasing.
And if $0.06899 gives way, $0.05743 is the next stop worth watching, with $0.04300 waiting behind it.
Disclaimer: This article is for information only and isn't financial advice. Crypto prices swing fast, so readers should research independently and risk only what can be lost comfortably.