TLDR: PENGU trades at $0.008845, gaining 5.76% daily and 25.60% weekly amid rising trading volume levels. Bollinger Bands are squeezing on PENGU’s weekly chart, signaling a possible volatilit
TLDR:
- PENGU trades at $0.008845, gaining 5.76% daily and 25.60% weekly amid rising trading volume levels.
- Bollinger Bands are squeezing on PENGU’s weekly chart, signaling a possible volatility breakout.
- Tom DeMark Sequential, Parabolic SAR, and SuperTrend indicators have all turned bullish on the chart.
- A breakout could push PENGU toward $0.025, with $0.045 as a further target, according to analysts.
PENGU may be entering the early stages of a bull run, according to new technical analysis. Pudgy Penguins’ native token traded at $0.008845, up 5.76% over 24 hours.
Trading volume during the same period reached $408,239,462 across major exchanges. The token also climbed 25.60% over the past seven days.
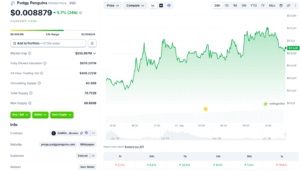
Source: CoinGecko
Chart analyst Ali Charts pointed to a tightening Bollinger Band squeeze paired with several bullish signals. The Tom DeMark Sequential, Parabolic SAR, and SuperTrend indicators have all turned positive. Together, these signals raise the question of whether PENGU’s next major move is near.
What the Charts Are Showing
A Bollinger Band squeeze on PENGU’s weekly chart is one reason behind the bullish question. This pattern forms when the upper and lower bands contract toward each other.
Analysts view such contractions as periods of reduced volatility before a sharp move. Multiple indicators now suggest that move could tilt toward the upside.
The Tom DeMark Sequential indicator adds further weight to the bullish case. Two consecutive buy signals have appeared on PENGU’s weekly chart recently.
The first formed as a 9 setup, followed by a Combo 13 signal. Together, these readings can mark the start of a new bullish countdown phase.
Parabolic SAR has also flipped bullish, with its dots now sitting below price. This shift often confirms that an uptrend is already underway. It may also act as dynamic support as PENGU continues climbing. The change reflects a broader move from bearish to bullish territory.
SuperTrend has turned into a buy signal as well, reinforcing the bullish question. Ali Charts noted a similar weekly signal appeared on PENGU before.
That earlier signal preceded a rally of 1,156%, based on referenced historical price data. The pattern is drawing comparisons to PENGU’s current setup.
Where PENGU Could Be Headed Next
PENGU’s price is currently contained within a parallel channel on the weekly chart. The channel’s mid-range near $0.025 stands as the first target if momentum builds. Reaching that level would mark a substantial move from current trading prices. This zone represents the first hurdle in the bullish scenario.
A break above the mid-range would put the channel’s upper boundary in play. That resistance sits near $0.045, based on the current chart structure.
From existing levels, this would represent roughly 430% upside for PENGU. The projection remains tied to the alignment of multiple bullish indicators.
Low volatility meeting strengthening momentum is central to the bull run question. A breakout from the current squeeze could trigger a sizable price move.
Contracting bands combined with aligned buy signals support this developing scenario. Traders are watching PENGU’s weekly chart closely for signs of confirmation.
At writing, PENGU traded near $0.008845 with 24-hour volume above $408 million. Its 25.60% weekly gain reflects momentum building steadily across recent sessions. Four separate indicators now point toward the same bullish direction. Whether PENGU’s bull run has truly started remains the market’s next question to answer.
The post Is a PENGU Bull Run About to Start? Here’s What the Charts Show appeared first on Blockonomi.
