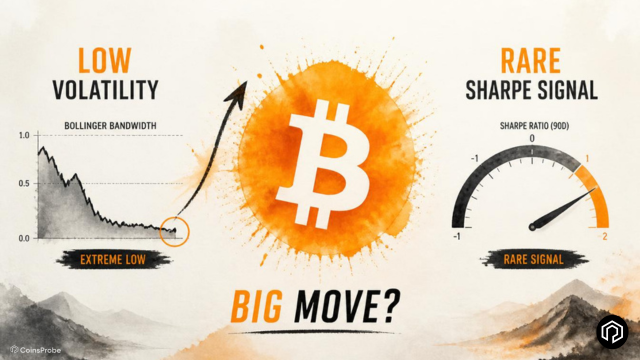
Key Highlights Bitcoin's Sharpe Ratio has dropped to -0.99 — deeply negative territory that has historically coincided with major long-term accumulation zones and significantly improved risk-
Key Highlights
- Bitcoin's Sharpe Ratio has dropped to -0.99 — deeply negative territory that has historically coincided with major long-term accumulation zones and significantly improved risk-reward for patient holders.
- The 30-Day Volatility has collapsed to approximately 0.01 — one of the lowest readings in Bitcoin's entire history — a compression level that has repeatedly preceded aggressive directional expansions.
- Both signals are firing simultaneously for the first time in this cycle, describing a Bitcoin market that is simultaneously cheap on a risk-adjusted basis and tightly coiled for a significant move.
Bitcoin is trading in the $64,000–$64,800 range as two independent long-term metrics from Alphractal are producing readings that have historically been among the most reliable precursors to significant Bitcoin price movements. Neither tells you which direction the move will come from. Both tell you — with unusual historical consistency — that the current period of quiet is unlikely to persist much longer.
Signal 1 — Sharpe Ratio at -0.99: Risk-Adjusted Returns at Historic Lows
The first signal comes from Alphractal founder Joao Wedson, who flagged that Bitcoin’s Sharpe Ratio has fallen to approximately -0.99 — placing it in deeply negative territory that has appeared only a handful of times in Bitcoin’s full market history.
What the Sharpe Ratio Measures
The Sharpe Ratio is one of the most widely used metrics in traditional and crypto finance — it measures the return an asset generates relative to the risk (volatility) required to hold it. A high positive Sharpe Ratio means strong returns relative to volatility — an efficient, rewarding investment environment. A deeply negative Sharpe Ratio means returns are poor relative to the volatility being experienced — a painful, inefficient investment environment for those holding through the current period.
A reading of -0.99 means Bitcoin is currently delivering near-maximum negative risk-adjusted returns — holders are experiencing significant volatility while the price grinds sideways or lower, producing a deeply unfavorable short-term experience.
 Bitcoin Sharpe Ratio/Source: @joao_wedson (X)
Why Deeply Negative Sharpe Readings Are Actually Constructive Long-Term
The counterintuitive — but historically well-documented — pattern around extreme negative Sharpe Ratio readings is that they tend to mark not the beginning of extended pain, but the later stages of it.
The Alphractal chart marks previous instances of deeply negative Sharpe Ratio readings with green vertical lines — and each of those prior instances aligns with what are now recognized as major Bitcoin accumulation zones:
PeriodSharpe Ratio ConditionWhat Followed2014–2015Deep negativeMulti-year cycle bottom → 2017 bull run2018–2019Deep negativeCycle bottom → 2020–2021 expansion2022–2023Deep negativeCycle bottom → 2023–2025 recoveryAugust 2026-0.99Current — pending
The logic is straightforward: a deeply negative Sharpe Ratio means the market has already been painful for an extended period — volatility has been high relative to returns, sentiment has been poor, and weak-handed holders have had every incentive to exit. By the time the Sharpe reaches extreme negative readings, the distribution of who holds Bitcoin has already shifted substantially toward higher-conviction participants — precisely the condition that has historically preceded recovery.
As covered in our Bitcoin ADCI accumulation zone analysis and Bitcoin LTH MVRV approaching historic accumulation levels, the risk-adjusted picture for Bitcoin at current levels is increasingly consistent with the historical profile of major cycle lows — and the Sharpe Ratio at -0.99 is the most direct quantification of that condition available.
Signal 2 — 30-Day Volatility at 0.01: The Tightest Compression in Years
The second signal operates on a different analytical dimension but points toward the same conclusion about what is likely coming next.
Bitcoin’s 30-Day Volatility has dropped to approximately 0.01 — a reading that places it near the lowest levels in its entire recorded history on the Alphractal chart. The current reading matches or approaches the floor of the orange volatility line across the full 2017–2026 period visible on the chart — a compression magnitude that has only appeared a handful of times.
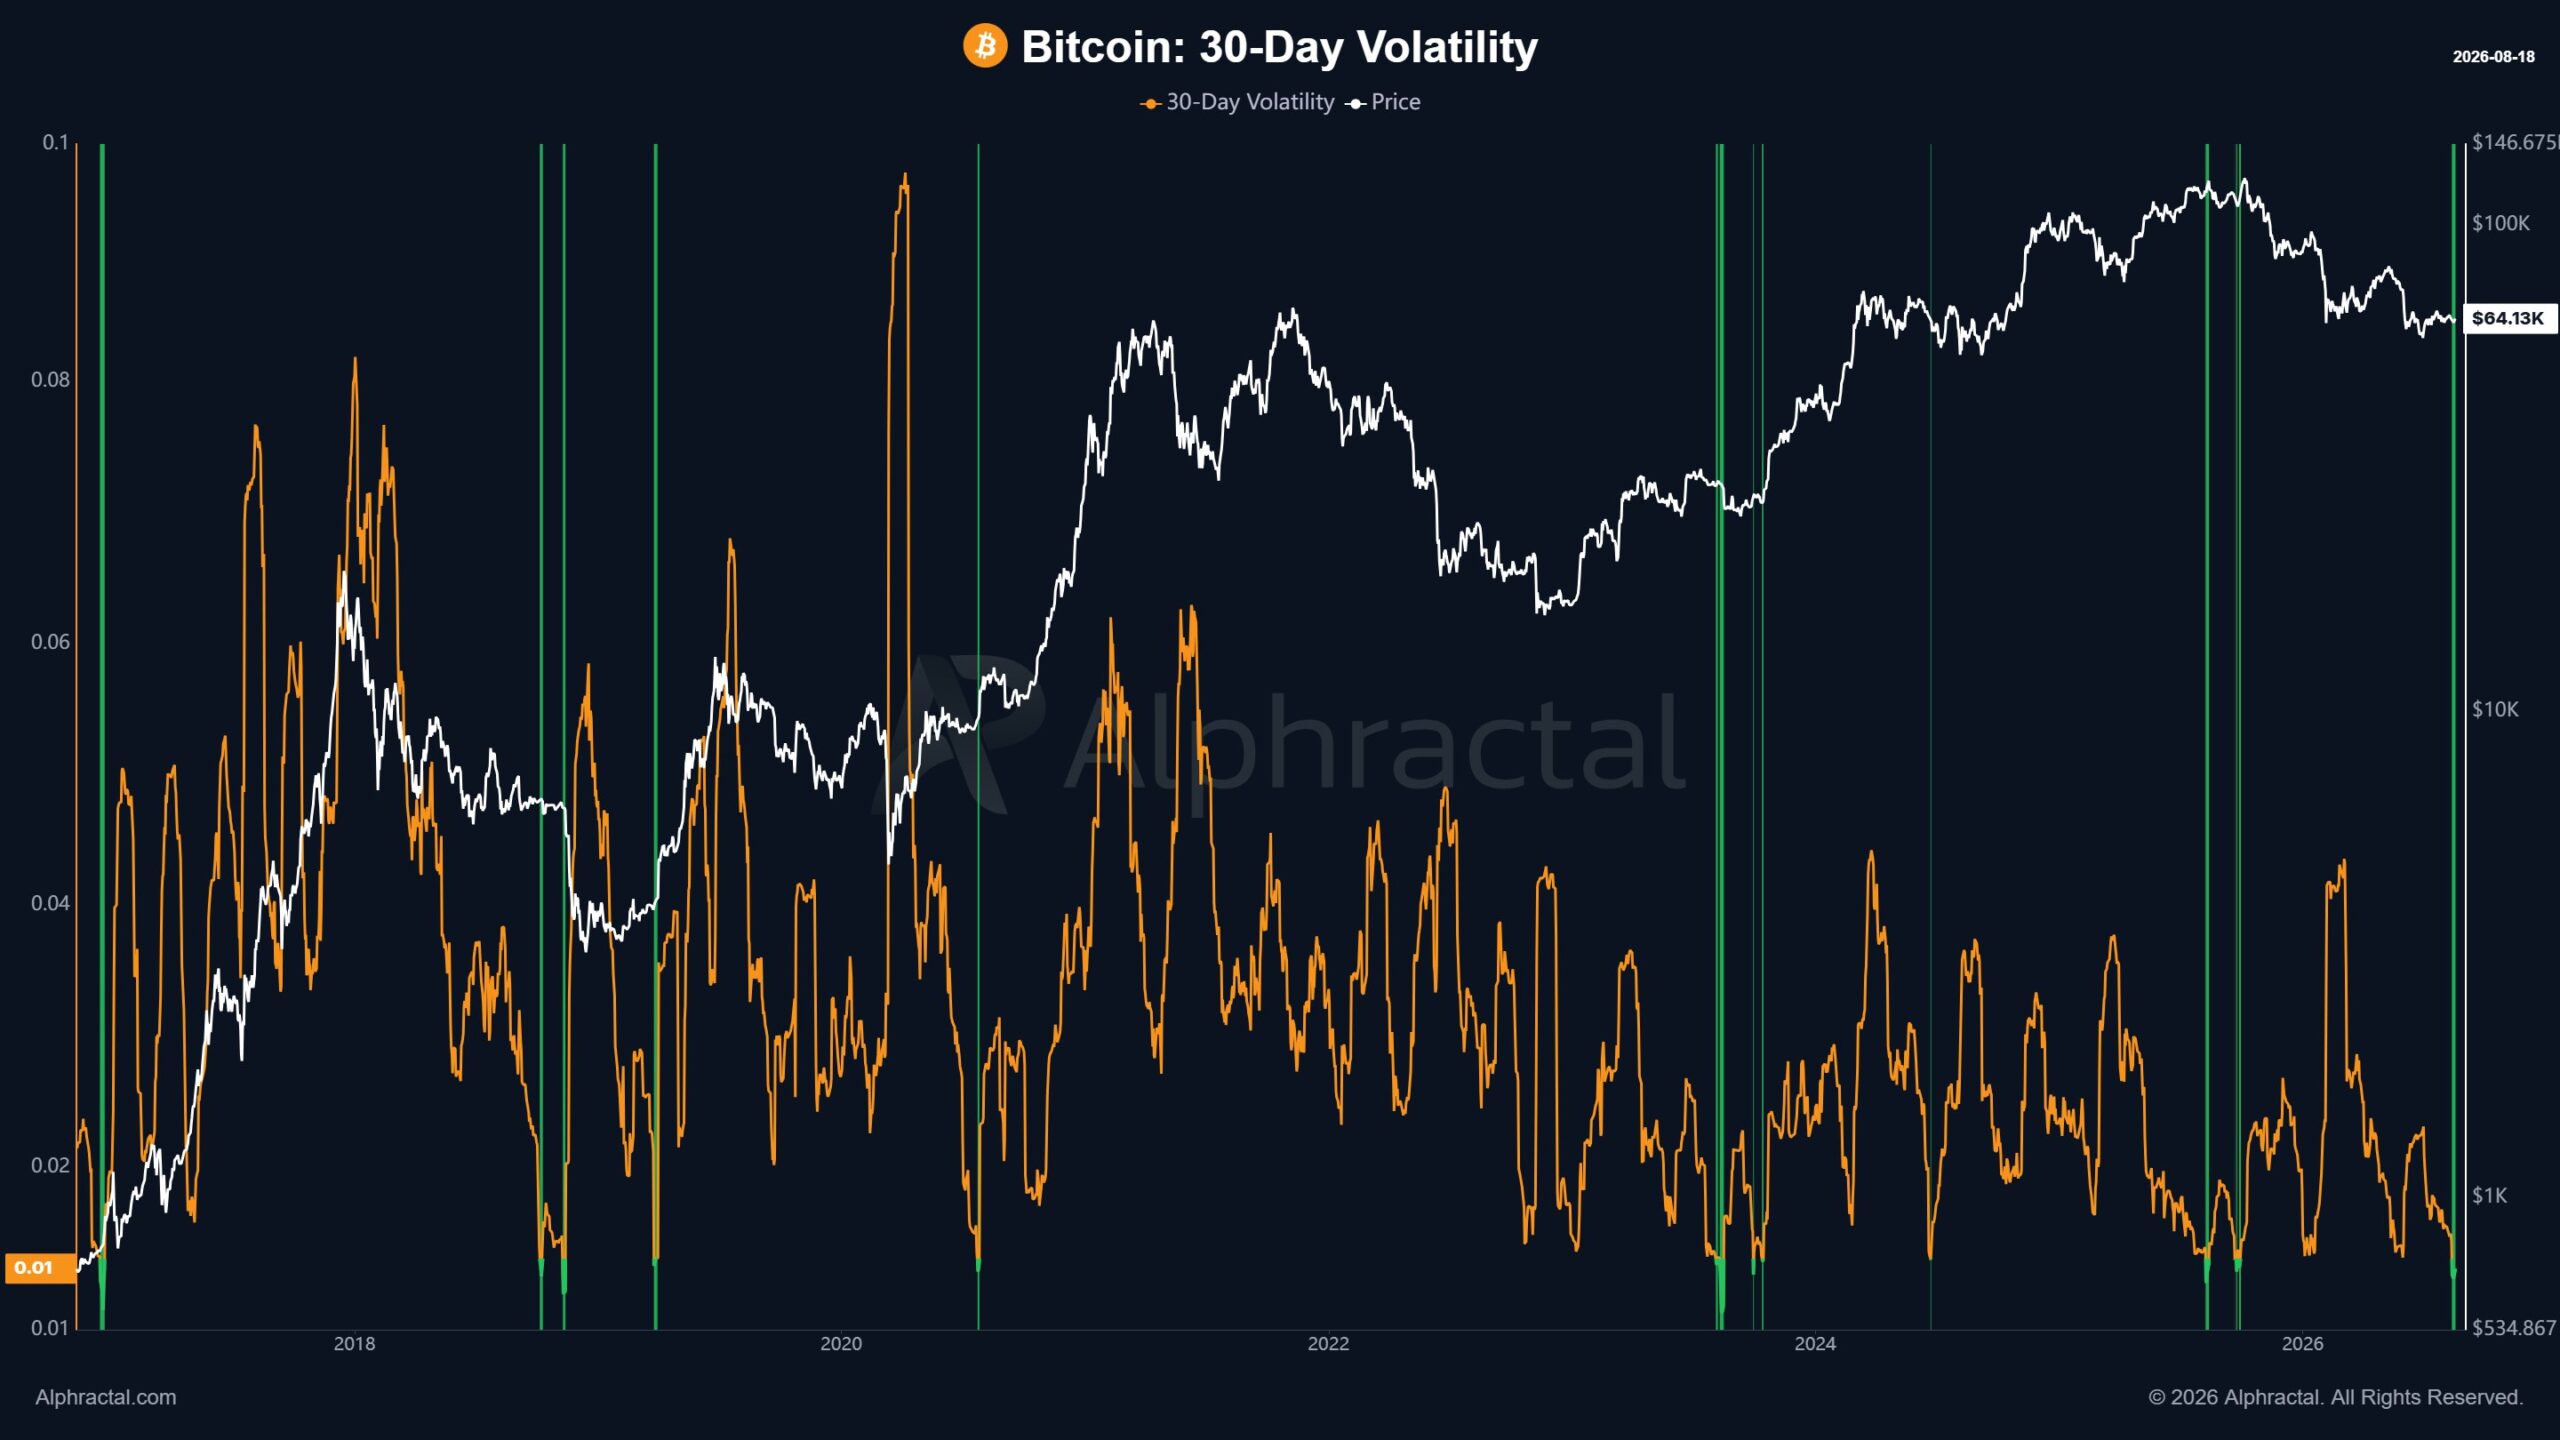 Bitcoin 30 Day Volatility/Source: @joao_wedson (X)
What 30-Day Volatility Compression Means
The 30-Day Volatility measure captures how much Bitcoin’s price has actually moved over the trailing month — normalized to produce a comparable reading across different price levels and time periods. At 0.01, the reading describes a market that has been moving with almost no directional momentum — price oscillating in a tight range without producing meaningful gains or losses on a 30-day basis.
Wedson’s analysis frames this through the lens of historical pattern recognition: periods of extreme 30-day volatility compression have consistently preceded significant directional moves. The green vertical markers on the Alphractal 30-Day Volatility chart identify previous instances of similar compression — and each one was followed by a major Bitcoin price move, either to the upside or downside, once the compression resolved.
The compression-expansion dynamic in volatility is one of the most consistent and cross-asset validated patterns in market analysis. Volatility does not remain at historically extreme lows indefinitely — the compression stores energy, and the eventual release tends to be proportional to the depth and duration of the compression phase.
As covered in our Bitcoin ADX 2-year low and BVOL7D 2.89 analysis, multiple independent volatility and trend-strength metrics have been simultaneously reaching historically extreme compression readings throughout August 2026. The 30-Day Volatility at 0.01 from Alphractal’s framework is the latest and most historically extreme of those readings.
Why Both Signals Together Create an Unusual Setup
The Sharpe Ratio at -0.99 and the 30-Day Volatility at 0.01 are measuring fundamentally different things — one measures risk-adjusted return quality, the other measures price movement magnitude. Their simultaneous appearance at historically extreme readings is what makes the current setup analytically significant.
The Sharpe Ratio at -0.99 says: Bitcoin’s return relative to risk is at a historically extreme low — a condition that has previously marked major accumulation zones and been followed by significantly improved long-term risk-reward.
The 30-Day Volatility at 0.01 says: Bitcoin’s price movement has compressed to near-record lows — a condition that has previously marked the final stages of consolidation before significant directional expansion.
Together, they describe a Bitcoin market that is simultaneously:
- Cheap on a risk-adjusted basis — the Sharpe Ratio is pricing in maximum pain relative to returns
- Tightly coiled for movement — the 30-day volatility compression is storing energy for a directional release
- Historically rare — both conditions at extreme levels simultaneously has appeared only a handful of times in Bitcoin’s full market history
The combination does not predict direction. It predicts magnitude — and it establishes that the current period of quiet is historically anomalous rather than a new normal.
What to Watch — The Conditions That Will Resolve the Setup
Sharpe Ratio turning toward zero and positive: A sustained improvement in Bitcoin’s return relative to volatility — driven either by price appreciation or by a reduction in volatility-without-gains — would signal the beginning of the Sharpe recovery phase that has historically followed negative extremes. Monitoring the Sharpe Ratio’s direction from -0.99 rather than its absolute level will provide the early signal of when the risk-adjusted environment is improving.
30-Day Volatility expanding from 0.01: When the compression ends — triggered by a macro catalyst, a technical breakout above or below the current range, or a shift in spot demand — the volatility expansion from 0.01 will likely be rapid and significant. The historical pattern from comparable compression levels has been an aggressive volatility expansion rather than a gradual one.
Direction of the breakout: As covered in our Bitcoin CPI liquidation heatmap analysis, the $64,800–$65,500 short liquidation cluster and $62,800–$63,200 long liquidation zone remain the immediate price-level triggers that will determine which direction the volatility expansion resolves. A sustained move into either zone will define the character of the breakout — and at 0.01 volatility compression, the move that follows is historically unlikely to be modest.
Bullish vs. Bearish Scenarios
Bullish Scenario
The Sharpe Ratio begins recovering from -0.99 as Bitcoin’s price moves higher — improving risk-adjusted returns and confirming that the negative extreme has passed. The 30-Day Volatility expands from 0.01 to the upside as Bitcoin breaks above the $64,800–$65,500 short liquidation zone, triggering the short squeeze dynamics and volatility expansion simultaneously. The combination of improving Sharpe Ratio and upward volatility expansion creates momentum that extends the move toward $68,000–$70,000 as the initial post-breakout target — consistent with the historical pattern where Sharpe negative extremes preceded major recovery phases.
Bearish Scenario
The volatility expansion from 0.01 resolves to the downside — Bitcoin breaks below $62,800–$63,200, triggering long liquidations and an accelerated move lower. The Sharpe Ratio dips further below -0.99 before eventually reaching the absolute extreme that has historically marked the final capitulation of prior cycles. In this scenario, the accumulation thesis remains intact but requires lower prices and more time — and the LTH MVRV approaches its sub-1.0 historical threshold that has marked the deepest and most definitive cycle lows.
Bottom Line
Bitcoin at $64,000–$64,800 on August 18, 2026 is presenting two of the most historically grounded non-directional signals in the Alphractal analytical framework — and both are at readings that have appeared only rarely in Bitcoin’s full market history.
The Sharpe Ratio at -0.99 places risk-adjusted returns at a historically extreme low — the same condition that, in 2015, 2019, and 2023, marked the final stages of major corrective cycles before sustained recovery began. The 30-Day Volatility at 0.01 places price movement compression at near-record lows — a coiling phase that has historically released into significant directional moves once a catalyst arrives.
Neither signal tells you which direction Bitcoin moves next. Both signals tell you — with the weight of Bitcoin’s full market history behind them — that the current period of compressed, poor-risk-adjusted-return consolidation is historically anomalous, and that the move that ends it is unlikely to be small.
Disclaimer: The views and analysis presented in this article are for informational purposes only and reflect the author’s perspective, not financial advice. Technical patterns and indicators discussed are subject to market volatility and may or may not yield the anticipated results. Investors are advised to exercise caution, conduct independent research, and make decisions aligned with their individual risk tolerance.