There is a certain kind of chart move that makes traders stop scrolling instantly, and Chainlink just delivered one of those moments. After weeks of grinding sideways, LINK has broken free an
There is a certain kind of chart move that makes traders stop scrolling instantly, and Chainlink just delivered one of those moments.
After weeks of grinding sideways, LINK has broken free and is now pushing higher with a conviction that has caught the attention of the entire community, sparking fresh Chainlink price prediction chatter across social media.
The bigger question everyone wants answered is whether this run has real staying power or whether it is simply the first leg of something much larger.
This is a purely technical and data-driven read of the Chainlink chart and current market conditions. It reflects no personal position in LINK and should not be treated as financial advice.
Chainlink Price Today: LINK Price Forecast and Trend Data
LINK is currently trading at 12.365, up 5.59 % over the past 24 hours. Futures volume over the last day sits at 559.40 million dollars, while spot volume is 137.46 million dollars, showing that leveraged traders are driving a meaningful share of this move.
Market cap stands at 9.24 billion dollars with open interest at 675.56 million dollars, a sign that fresh positions are actively being opened rather than just existing ones being closed out.
Circulating supply, total supply, and max supply are all aligned at 748.09 million out of 1.00 billion LINK, meaning there is still meaningful supply left to enter circulation over time.
Source: CoinGlass, September 19, 2026.
Chainlink Latest News: LINK Price Prediction Buzz
The Chainlink news cycle today is being shaped less by an official announcement and more by community energy. 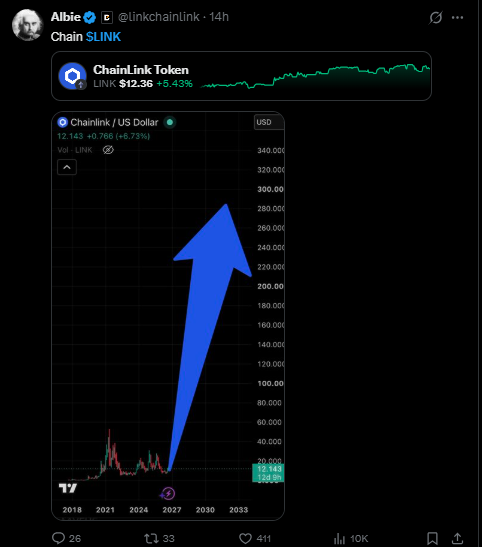
A widely circulated post from Albie on X showcased a Chainlink Token price card putting LINK at 12.36 dollars, up 8.43%, paired with a long-range chart carrying a bold arrow projecting a climb toward roughly 300 dollars sometime between 2027 and 2033.
It is worth being clear that this is a speculative, community-driven long-term target rather than a confirmed forecast from any institution, but it captures just how bullish sentiment has become around LINK following this breakout.
Posts like this tend to amplify retail interest quickly, and combined with the actual price action, it has clearly added fuel to the broader LINK price prediction conversation this week. Source: Albie on X, September 19, 2026.
Quick Take
CMP: 12.371 on the Binance LINK/USDT perpetual 4h chart
Bullish trigger: 4h close above 13.686 opens the path to 15.000 and 20.220
Bearish trigger: 4h close below 10.630 shifts focus to 9.319
Data timestamp: chart and market data as of September 19, 2026, 11:25 IST
Risk note: rising open interest alongside price strength means sharp wicks are possible if leveraged positions get squeezed
Chainlink Technical Analysis: LINK Price Target Outlook
Pull up the 4h Chainlink chart on Binance, and the structure tells a compelling story. 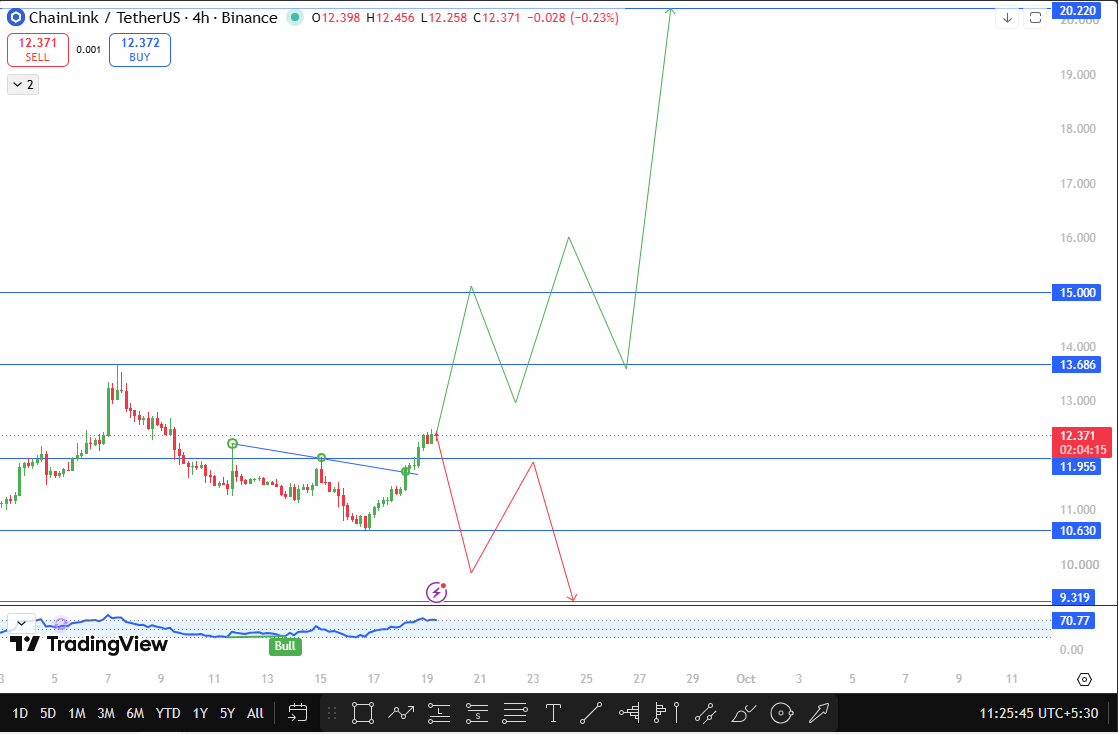
$LINK had been consolidating below a descending trendline for a while, coiling up energy the way markets often do before a real move.
That trendline finally gave way, and instead of fading back down the way many breakouts do, price kept climbing, clearing the earlier flip zone near 11.955 and turning what used to be resistance into a support shelf underneath current price action.
That kind of clean level flip is one of the stronger signs that a breakout has genuine follow-through rather than being a temporary spike.
The momentum picture backs this up as well. The oscillator on the chart is carrying a labeled Bull signal with a reading near 70.77, which reflects strong underlying momentum without yet screaming exhaustion. Price is currently sitting at 12.371, and the next real test ahead is 13.686.
This level matters because it represents the next meaningful supply zone on the chart, and a 4h close above it would essentially confirm that buyers are willing to keep pushing through resistance rather than just probing it.
If $LINK does manage that close above 13.686, the door opens toward 15.000, a psychologically significant round number that often acts as a natural target for momentum traders.
Beyond that, the more ambitious Chainlink price forecast target sits at 20.220, a level that would represent a substantial extension of the current move and would likely require sustained buying interest over several sessions rather than a single burst higher.
On the other side of this setup, 10.630 is the level that keeps the entire bullish structure intact. As long as LINK holds above it, the breakout narrative remains valid.
A 4h close below that level would suggest the move has lost its underlying strength, and from there the next logical support for buyers to lean on would be 9.319.
Support and Resistance Levels
Level Type
Price
Distance from CMP (12.371)
Resistance 3
20.220
+63.4%
Resistance 2
15.000
+21.3%
Resistance 1
13.686
+10.6%
Current Price
12.371
—
Support 1 (former resistance)
11.955
-3.4%
Support 2
10.630
-14.1%
Support 3
9.319
-24.7%
Bull, Base, and Bear Scenarios
In the bullish path, LINK holds its ground above the reclaimed 11.955 level and pushes through 13.686 on a clean 4h close.
That kind of confirmation would likely draw in momentum traders who have been watching from a distance, and from there 15.000 becomes a realistic short-term target, with 20.220 sitting further out as the reward for those willing to hold through the volatility along the way.
The base case, and arguably the most probable near-term outcome, has LINK spending some time consolidating between the 11.955 support and the 13.686 resistance shelf.
After a move this sharp, a period of digestion is completely normal and would let the market absorb both the technical breakout and the wave of social attention it has generated before committing to the next leg.
The bearish scenario would involve LINK losing the recently reclaimed 11.955 support and eventually slipping below 10.630 on a 4h close. That would be a meaningful shift in tone, signaling that the breakout ran out of steam faster than expected, and sellers would likely aim for the 9.319 support zone from there.
Long-Term Outlook 2027-2033
$LINK could potentially reach $300 in the long term if Chainlink adoption, network utility, and broader crypto market growth continue to expand. However, $300 is a speculative long-term scenario, not a guaranteed price target.
Short-term technical levels should not be interpreted as a prediction that LINK will reach $300. This report is for informational purposes only. Not financial advice.
Risks to Watch
Open interest climbing alongside price is generally a healthy sign, but it also means there are more leveraged positions that could get liquidated in either direction if momentum stalls suddenly.
Community-driven price targets, like the long-term projection circulating on social media, can inflate sentiment quickly, and any pullback after that kind of hype can feel sharper than the move that came before it.
Broader market conditions across crypto remain an outside factor as well, since even a technically strong LINK setup can be disrupted by a sudden shift in risk appetite elsewhere.
Glossary
Flip zone: A price level that previously acted as resistance and, once broken, begins functioning as support, or vice versa.
4h close: The final price at which an asset trades before a 4 hour candle finishes, commonly used to confirm intraday breakouts.
Open interest: The total number of outstanding derivative contracts that remain unsettled, indicating active leveraged positioning in the market.
Momentum oscillator: A technical indicator that measures the speed and strength of recent price moves to gauge whether a trend is gaining or losing power.
Disclaimer
This article is for informational purposes only and does not constitute financial advice. Cryptocurrency markets are highly volatile, and readers should conduct their own research before making any investment decisions.