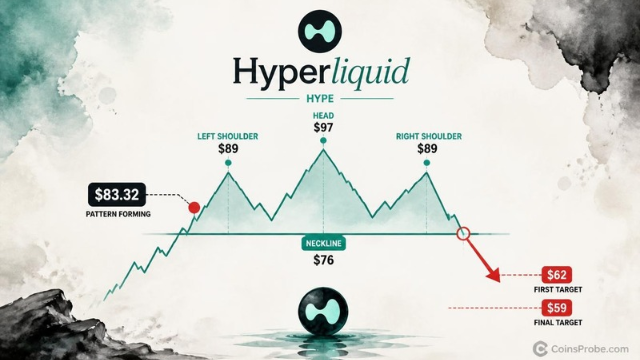
Key Highlights HYPE is trading at $83.32 — forming a head-and-shoulders top on the 12-hour chart with a 22% correction implied Neckline zone: $76–$78; confirmation requires a sustained 12-hou
Key Highlights
HYPE is trading at $83.32 — forming a head-and-shoulders top on the 12-hour chart with a 22% correction implied
Neckline zone: $76–$78; confirmation requires a sustained 12-hour close below that level per the analyst
Hyperliquid protocol shows $8.11B TVL and $84.78M in 30-day fees per DeFiLlama — fundamentals remain intact
Hyperliquid’s HYPE token is trading at approximately $83.32 on the 12-hour chart — sitting below its recent peak near $89 and well below the cycle high near $97, in a technical structure that one analyst identifies as a textbook head-and-shoulders reversal. The pattern, if confirmed, implies a 22% correction from current levels.
A crypto analyst flagged the developing formation on November 2, 2026, outlining a precise setup: a sustained 12-hour close below the $76–$78 neckline triggers the pattern, with a first target at $62 and a final downside objective at $59. Crucially, the analyst is not anticipating the breakdown — the note is explicit that no position is warranted until the neckline gives way. As the analyst states: “Confirmation: A sustained 12-hour close below the $76–$78 neckline.”
The head-and-shoulders is among the most widely recognized reversal formations in technical analysis. It requires three sequential peaks — a left shoulder, a higher central peak (the head), and a lower right shoulder — with a horizontal neckline connecting the troughs between them. The setup becomes a confirmed breakdown only when price closes below that neckline with sustained conviction, not on an intraday wick.
On HYPE’s 12-hour chart spanning mid-September through early November, the structure is clearly formed: a Left Shoulder, a Head near the $97 region, and a Right Shoulder near $89. The neckline is drawn near $76. At the time of the analyst’s flag, HYPE is printing at $83.32 — above the neckline but below both the right shoulder and the head. The pattern is still forming. No breakdown has been confirmed yet.

HYPE 12HR Chart Analysis | Source: @alicharts (X)
The measured move from head to neckline projects approximately 22% of downside below $76, which lands near $59 — consistent with the analyst’s stated final target. The intermediate stop at $62 represents the first zone of interest if sellers accelerate.
The analyst’s framework reduces to a binary: the $76–$78 neckline holds, or it doesn’t.
A sustained 12-hour close below $76 — not an intraday pierce, not a wick — is the stated confirmation. That distinction matters. Neckline fakeouts are common in head-and-shoulders setups; a candle body close is the only signal the analyst is treating as actionable. If that break occurs, the first target is $62, followed by $59 as the full measured-move destination.
On the upside, the analyst identifies recovery above the right shoulder high — near $89 — as the invalidation condition. A reclaim of that level would structurally negate the right shoulder formation and shift the pattern’s interpretation. Between $83 and $89, the structure remains ambiguous: the pattern is forming, but neither thesis is confirmed.
The technical setup exists against a backdrop of exceptional protocol fundamentals. Hyperliquid’s on-chain data, per DeFiLlama as of November 3, 2026, shows $8.11B in total value locked, $181.92M in 24-hour DEX volume, and $3.20M in 24-hour fees. Over the trailing 30 days, the protocol generated $84.78M in fees on $4.15B in DEX volume — metrics that reflect genuine user activity, not speculative positioning alone.
This matters for interpreting the technical pattern. A head-and-shoulders top in a protocol with contracting fundamentals is a straightforward distribution thesis. In HYPE’s case, the on-chain engine remains running — which means the pattern’s resolution is driven by market structure and sentiment, not fundamental deterioration. The ICE and trade.xyz partnership that drove HYPE’s 16.7% surge earlier this cycle reflects genuine demand for the protocol. Whether that demand translates into price support at the neckline is the question the chart will answer.
It is also worth noting that five whales opened $52.7M in HYPE long positions on Hyperliquid Perps — a data point that, in combination with the analyst’s bearish chart setup, creates a tension between large leveraged longs and a deteriorating technical structure. If the neckline cracks, those leveraged positions face forced liquidation, which can accelerate the move to $62 faster than the measured-move math alone would suggest.
The timing of this setup overlaps with a dense macro calendar. Nonfarm Payrolls release November 6, CPI on November 10, and PPI on November 13 — three sequential macro prints within a two-week window. Any risk-off shock from these releases could provide the external catalyst that tips HYPE’s price below the $76–$78 zone, converting a technically forming pattern into a confirmed breakdown. Conversely, a strong risk-on reaction could provide the bid that invalidates the right shoulder entirely.
Bearish Scenario — Neckline Breaks at $76
A sustained 12-hour candle close below $76 confirms the head-and-shoulders. First target: $62. Final measured-move target: $59. Leveraged long liquidations between $76 and $62 could compress that range’s duration significantly.
Bullish Scenario — Recovery Above $89
A reclaim of the right shoulder high near $89 structurally invalidates the right shoulder of the pattern. That move would shift the chart back to a range-bound interpretation rather than a topping formation. The analyst explicitly names this as the invalidation condition.
HYPE’s 12-hour head-and-shoulders is a clearly formed, technically valid setup — but it remains unconfirmed at $83.32. The analyst has drawn the line at $76–$78: a sustained close below that level is the only trigger for the $62 and $59 targets. Above $89, the pattern is invalidated. Everything between those two levels is noise. Watch the $76 neckline on the 12-hour chart — that is where the thesis resolves.
Disclaimer: The views and analysis presented in this article are for informational purposes only and reflect the author’s perspective, not financial advice. Technical patterns and indicators discussed are subject to market volatility and may or may not yield the anticipated results. Investors are advised to exercise caution, conduct independent research, and make decisions aligned with their individual risk tolerance.
Also Read: TOTAL2 Wave 2 Correction Ending — Analyst Eyes $3.15T Cycle Top