Key Highlights Solana (SOL) is trading at $75.31, down 7.06% in 7 days and nearly 40% YTD, amid broader market weakness. Analyst Michaël van de Poppe says the current level is "make or break"
Key Highlights
- Solana (SOL) is trading at $75.31, down 7.06% in 7 days and nearly 40% YTD, amid broader market weakness.
- Analyst Michaël van de Poppe says the current level is "make or break" — holding support could spark a bounce, while a drop below $73 may trigger another leg lower.
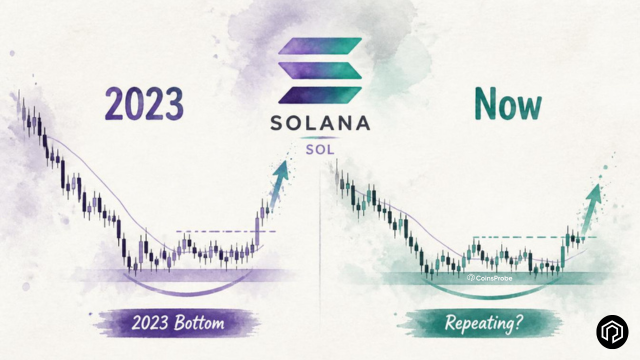
- SOL's current structure closely resembles its 2023 correction pattern, raising hopes of a potential repeat recovery.
- The $76–$97 range remains critical for bulls, with a breakout targeting $120–$125, while a break below $73 risks deeper downside.
Solana (SOL) is trading at $75.31, down 7.06% over the past 7 days. The token’s market capitalization stands at approximately $43.85 billion.
Broader weakness across Bitcoin and the altcoin market has pushed SOL back under the psychologically important $100 level (three digits). Year-to-date, SOL is down nearly 40%, reflecting the challenging macro environment and risk-off sentiment in crypto.
 Solana (SOL) Price on 14 July 2026/Source: Coinmarketcap
What’s Driving the Weakness
SOL’s current pressure is not isolated — it is happening within a broader market environment that has been difficult for altcoins throughout 2026. As we covered in our 5-year altcoin sell pressure extreme article — the altcoin market has experienced $209 billion in net outflows over 15 consecutive months, with only 36 of the top 100 altcoins remaining profitable for holders. SOL is operating within that structural headwind rather than against a token-specific problem.
The near-term catalysts compounding that structural pressure:
Bitcoin’s sideways-to-weak action — Bitcoin hovering in the $60,000–$65,000 range without a clear directional breakout removes the risk-on tailwind that altcoins need to sustain momentum. When Bitcoin is uncertain, altcoins amplify that uncertainty.
Profit-taking across the altcoin sector — The 30-day +10.39% performance reflects that SOL did rally earlier in the month — creating a cohort of recent buyers now taking profits as price retreats.
Technical Setup – Make or Break Levels
Analyst Michaël van de Poppe (@CryptoMichNL) provided the most direct framing of the current setup:
“It’s a make or break level for $SOL. If this level does hold, we’re able to see a quick bounce upwards… Failing to do that, breaking <$73 and I’m looking to see a test of the lows happen in the coming weeks.”
This is one of the cleaner binary setups in the current altcoin market — not a complicated multi-scenario analysis, but a clear pivot point where one of two outcomes becomes significantly more likely depending on whether a specific price level holds or breaks.
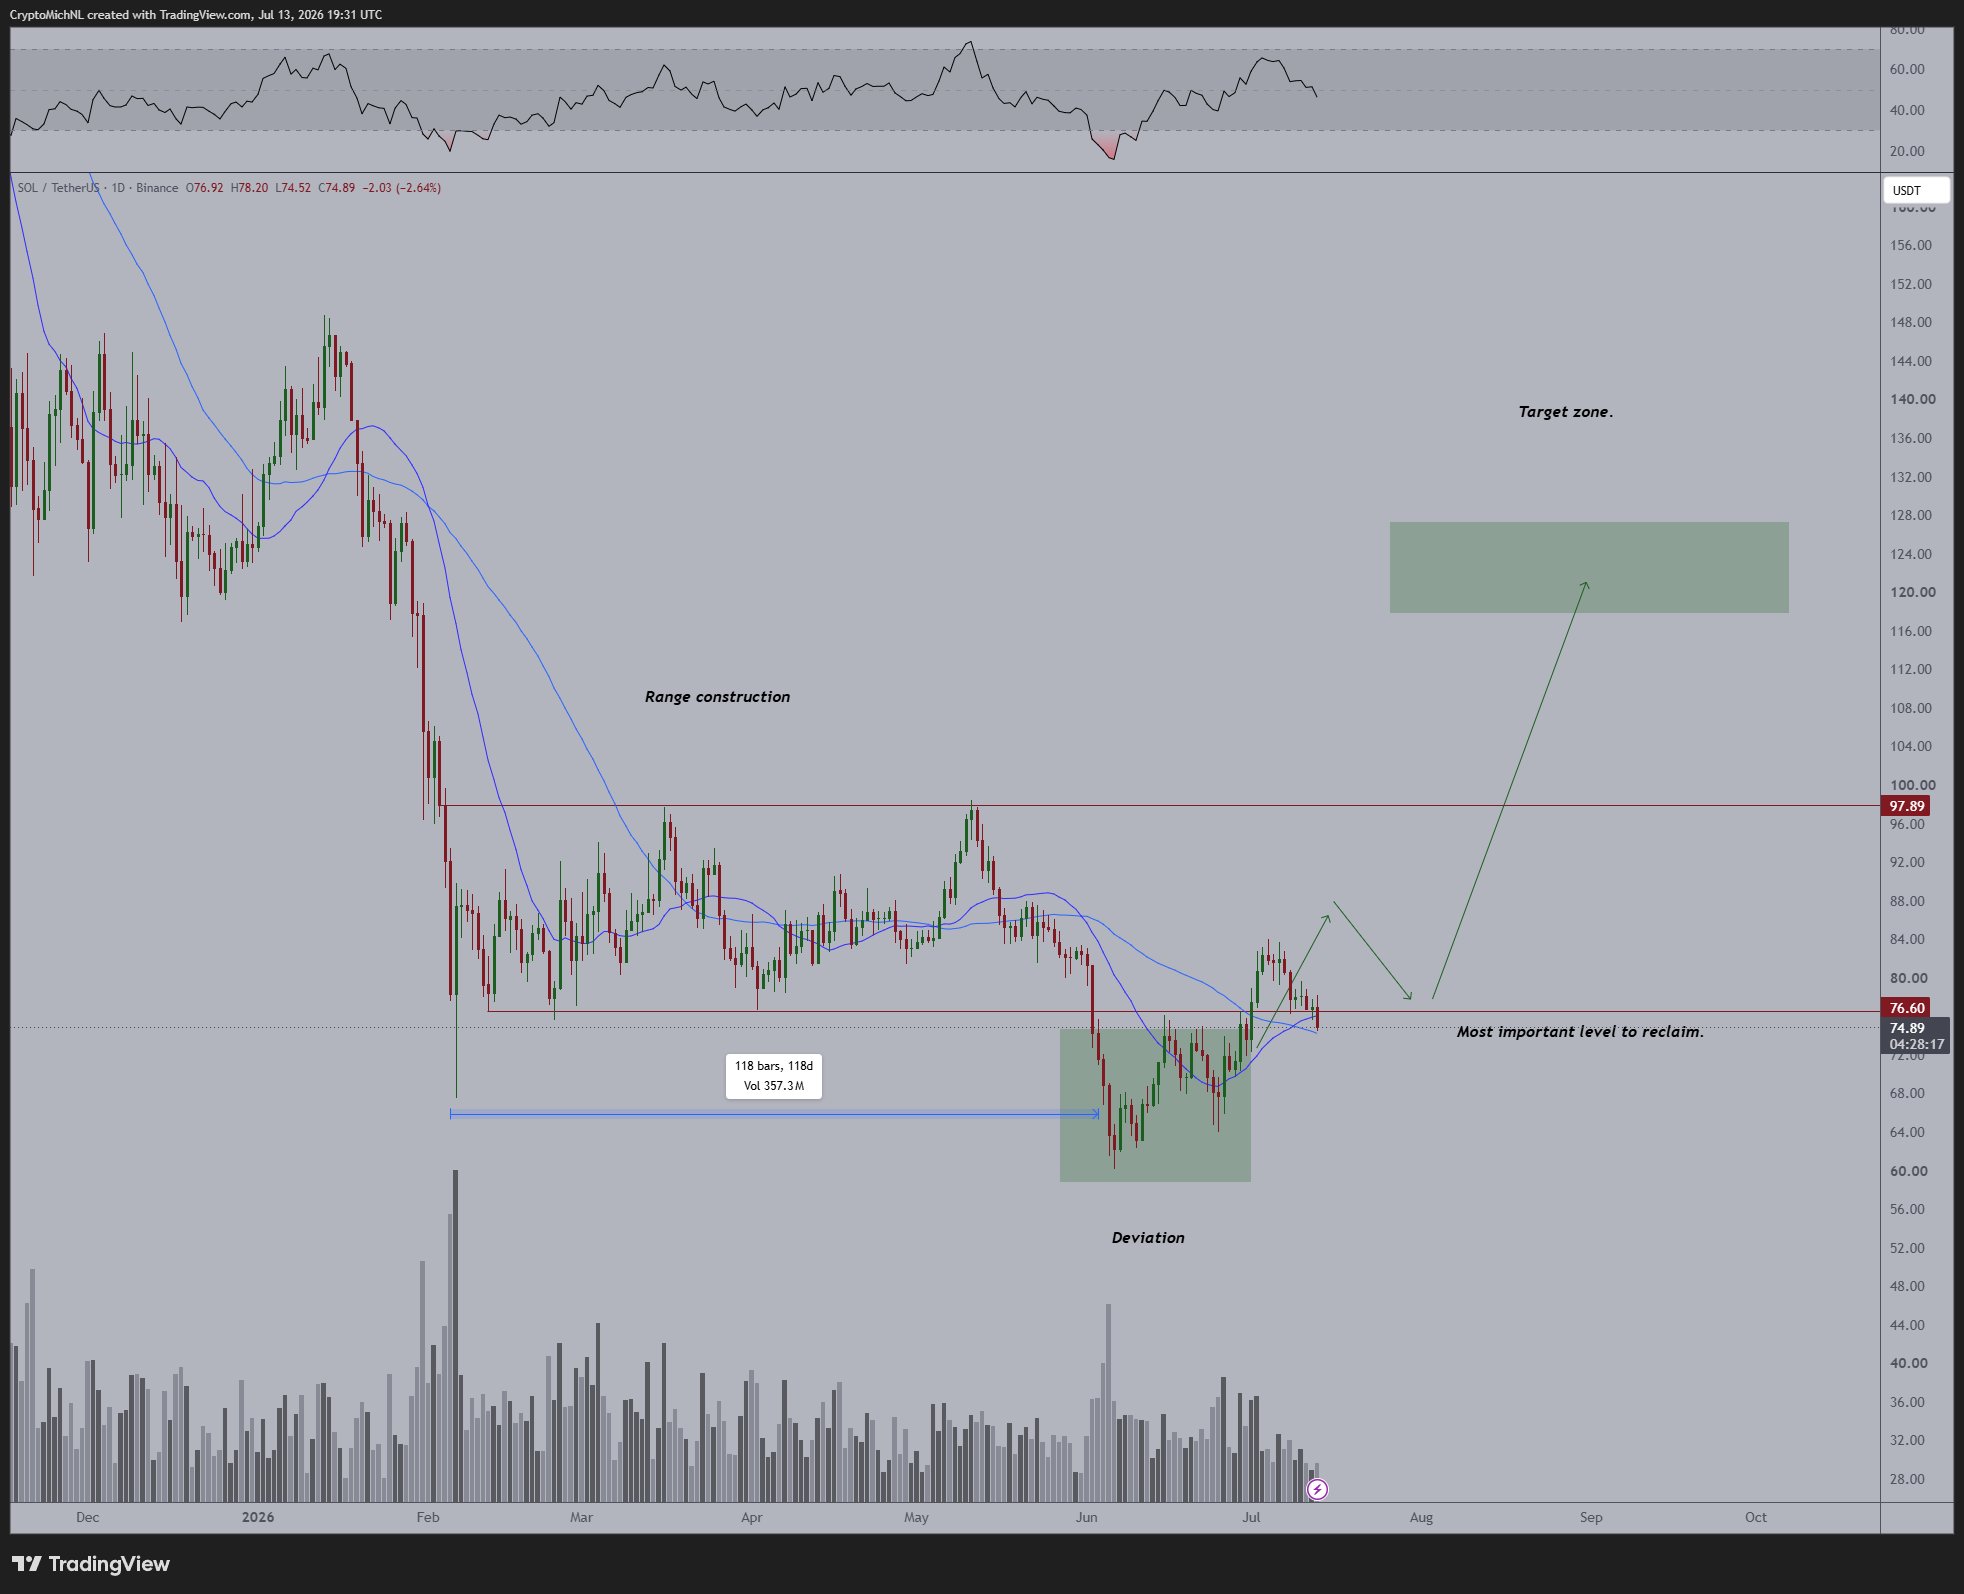 SOL Daily Chart/Credits & Source: @CryptoMichNL (X)
If $73 holds: A quick bounce toward the upper end of the current range — the $76–$97 zone — becomes the expected near-term path, with the potential for further continuation if momentum builds.
If $73 breaks: Van de Poppe sees a retest of recent lows as the likely outcome in the coming weeks — consistent with the broader bearish technical structure of lower highs and lower lows visible on SOL’s daily chart.
The 2023 vs 2026 Pattern Comparison
A separate perspective comes from trader @Ryker_Crypto, who is taking a longer-term as SOL right now involves a direct comparison of its 3-day chart structure in 2023 and 2026.
 SOL 2023 Fractal Chart/Credits & Source: @Ryker_Crypto
The side-by-side charts show striking structural similarities across several dimensions:
- Comparable depth and pace of the initial correction from cycle highs
- Similar consolidation phase structure following the sharp decline
- Matching wick patterns at key support levels — the kind of wicks that reflect buyers stepping in aggressively at lows
- Comparable recovery attempt patterns from the consolidation base
In 2023, this exact structure — sharp correction, consolidation with characteristic wicks, gradual base formation — preceded Solana’s historic recovery from sub-$10 levels to the $200+ range that characterised the 2024 bull cycle.
The pattern comparison does not guarantee the same outcome in 2026. But it provides the analytical framework that bulls are using to argue that the current consolidation is a base-building phase rather than the beginning of a deeper structural breakdown. As we covered in our Solana Wyckoff Phase D and ETF analysis article — the Wyckoff accumulation framework has been pointing to SOL’s $97–$99 zone as the key breakout trigger for Phase E markup, a technical thesis now being tested by the current pullback below $80.
Bullish Scenario — $73 Holds
SOL defends the $73 floor and begins building a base within the $73–$76 support zone. A quick bounce toward the upper end of the $76–$97 range follows — with a sustained break above $97–$99 (the Wyckoff Phase D neckline) targeting the $120–$125 zone consistent with both the 2023 fractal comparison and the Wyckoff measured move.
Bearish Scenario — Break Below $73
A sustained close below $73 triggers Van de Poppe’s projected outcome — a retest of recent lows in the coming weeks. Given the broader altcoin sell pressure environment and SOL’s -40% YTD performance, a break below $73 without swift recovery would risk extending the consolidation range significantly lower before the next meaningful recovery attempt.
Bottom Line
Solana is sitting at a genuinely important technical decision point — the $73–$76 support zone that Michaël van de Poppe has identified as make-or-break for the near-term trajectory. The 2023 fractal comparison provides the bullish historical framework. The $73 breakdown level provides the bearish trigger. And the broader altcoin structural headwinds provide the macro context within which this decision point is being tested.
The answer will likely come in the next few trading sessions — either $73 holds and a bounce begins building the case for a return toward $97–$99 and beyond, or it breaks and the more patient approach advocated by traders like @Ryker_Crypto — waiting for a clearly better entry — proves to have been the right call.
Disclaimer: The views and analysis presented in this article are for informational purposes only and reflect the author’s perspective, not financial advice. Technical patterns and indicators discussed are subject to market volatility and may or may not yield anticipated results. Investors are advised to exercise caution, conduct independent research, and make decisions aligned with their individual risk tolerance.
Also Read: Pi Network (PI) Dips to New ATL as Market Cap Falls Below $1 Billion — Here’s Why.