Justin Sun endorsed TRX’s reported outperformance against major cryptocurrencies, suggesting that 2027 could bring further gains. TRON’s stablecoin activity supports demand for network resour
- Justin Sun endorsed TRX’s reported outperformance against major cryptocurrencies, suggesting that 2027 could bring further gains.
- TRON’s stablecoin activity supports demand for network resources, although recent TRX issuance has exceeded token burning.
- The daily chart shows compressed moving averages and subdued RSI momentum, without a clearly confirmed directional reversal.
TRON founder Justin Sun has expressed renewed optimism about TRX after the cryptocurrency reportedly outperformed Bitcoin and several other major digital assets over the past year.
Responding to a November 8 post on X describing TRX as a “marathon champion,” Sun wrote, “2027 will be better.”
The accompanying comparison showed TRX gaining 8.85% over the preceding year while Bitcoin declined 26.67%. Ethereum, BNB and Solana were also presented as underperforming TRX.
Using the quoted figures, the implied appreciation of TRX against Bitcoin is approximately 48.4%, calculated from the ratio of their respective total-return factors.
The comparison’s exact historical timestamps have not been independently established, so the ranking remains attributed to the original post.
TRON’s underlying network economics offer a more substantial basis for evaluating whether the token’s relative resilience can persist.
TRON’s Stablecoin Activity Supports Native Token Demand
TRON has established a significant role in dollar-denominated cryptocurrency transfers, particularly through Tether’s USDT.
According to TRONSCAN, approximately $94.2 billion in USDT was circulating on the network in the referenced November snapshot.
Over seven days, TRON recorded more than 16 million USDT transfers, representing approximately $177.8 billion in reported transaction volume.
These figures measure on-chain activity, not unique capital inflows. Repeated transfers involving the same funds can substantially increase transaction totals.
Nevertheless, stablecoin settlement creates an identifiable economic use for TRX.
TRON operates through a resource model in which transactions consume bandwidth and smart-contract execution requires Energy. Users can obtain resources by staking TRX or pay fees when their available resources are insufficient.
Businesses processing frequent stablecoin transfers therefore have incentives to acquire TRX, stake it or obtain delegated resources from third-party providers.
The relationship is not one-to-one. Higher USDT transfer volumes do not automatically produce proportional purchases of TRX, particularly when users rely on existing staked resources or Energy rental services.
Network Revenue and Token Scarcity Tell Different Stories
The distinction becomes clearer when examining TRON’s supply mechanics.
The TRONSCAN revenue dashboard recorded approximately $215.9 million in protocol revenue over the preceding 30 days.
That headline figure combines revenue categories associated with staking and token burning. It should not be interpreted as an equivalent amount of tokens permanently destroyed or cash distributed to all TRX holders.
The network’s issuance and burn records provide a more direct measure of monetary conditions.
On November 7, approximately 3.92 million TRX was generated through block-production and voting rewards, while around 1.80 million TRX was burned.
The resulting net supply increase was approximately 2.11 million TRX.
TRONSCAN’s reported annualized inflation estimate stood near 0.49%, reflecting prevailing conditions rather than a fixed future issuance rate.
This creates a distinction between network adoption and token value accrual.
Stablecoin usage can support demand for TRON’s transaction resources while validator and voting rewards continue to expand token supply.
For TRX holders, the monetary outcome depends on the balance between issuance, staking participation, fee consumption and token destruction.
TRX Momentum Weakens as Moving Averages Converge
The daily TRX/USD chart from Kraken, captured through TradingView on November 8, shows the token trading around $0.3199.
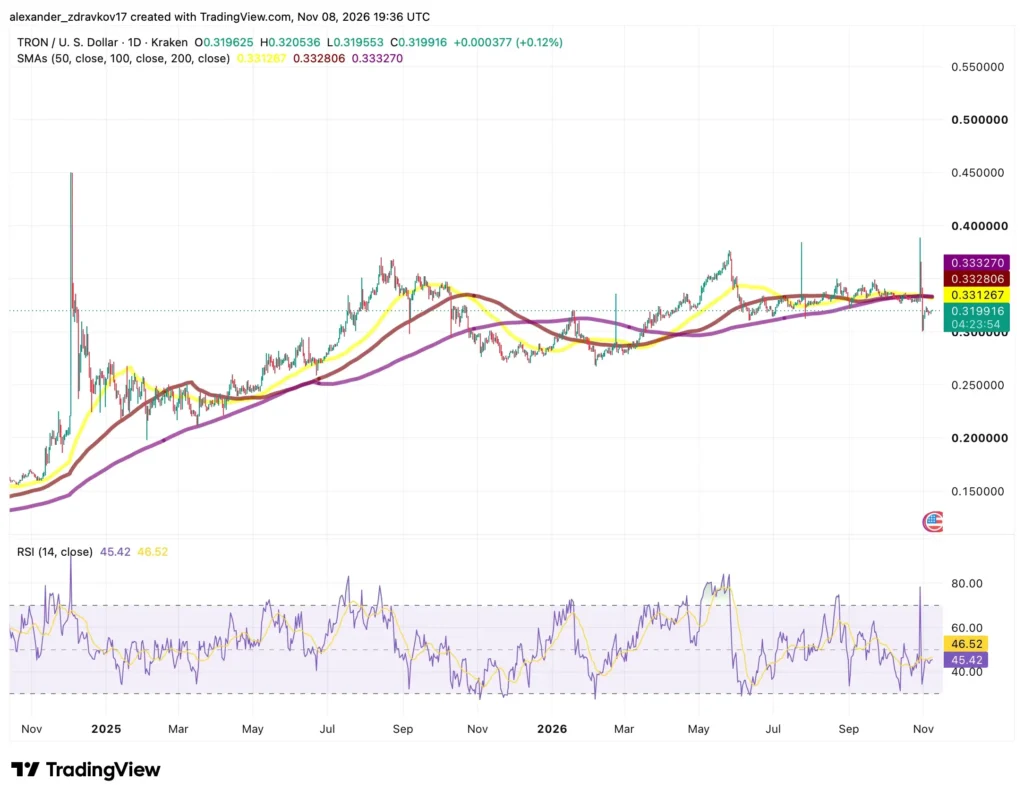
TRON trades below its key moving averages as bearish pressure persists. Chart: Alexander Zdravkov/TradingView.
Three major simple moving averages have converged within a narrow range, reflecting a market that has spent considerable time consolidating rather than establishing a sustained directional trend.
TRX/USD Technical Indicators
Daily chart | Kraken | November 8, 2026
Indicator
Reading
50-day SMA
$0.331267
100-day SMA
$0.332806
200-day SMA
$0.333270
RSI (14)
45.42
Source: TradingView, Kraken TRX/USD daily chart. Captured November 8, 2026, at 19:36 UTC. Chart by Alexander Zdravkov. Readings are historical snapshots.
The moving averages are separated by only approximately 0.6%, suggesting that their individual readings offer limited differentiation as technical reference points.
TRX is currently trading below all three averages, indicating weaker short-term positioning relative to its recent trading history.
However, their proximity does not independently establish a reliable resistance zone. Moving averages are dynamic trend measures, and their effectiveness as support or resistance depends on repeated price reactions and broader market context.
The 14-day Relative Strength Index also remains below its neutral midpoint, indicating that recent price momentum favors sellers without reaching conventional oversold territory.
The chart does not show a confirmed bullish reversal. Equally, the available structure is insufficient to establish precise downside targets with confidence.
A stronger technical assessment would require clearer swing points, confirmed changes in market structure and supporting trading-volume evidence.
Why TRX/BTC Is Central to Sun’s Argument
Sun’s statement emphasizes comparative performance rather than an immediate price breakout.
That makes the TRX/BTC relationship particularly relevant.
A cryptocurrency can outperform Bitcoin during a broad market decline without establishing a strong bullish trend against the US dollar.
The reported annual returns illustrate that distinction. TRX’s modest positive performance contrasts with Bitcoin’s substantial decline, creating a significant relative gain even without an exceptional absolute advance.
Such resilience may reflect differences in investor positioning, selling pressure or demand for the underlying network.
TRON’s transaction-resource model provides one plausible source of recurring native-token demand, but the available data does not establish a direct causal relationship between stablecoin activity and TRX’s reported price outperformance.
Nor does the calculated relative gain substitute for an independently verified TRX/BTC chart showing the development of that trend over time.
For investors assessing Sun’s outlook, sustained relative performance would carry more weight than a single annual comparison.
What Could Sustain TRX’s Relative Strength?
TRON enters the final weeks of 2026 with substantial stablecoin settlement activity and an economic model that links network usage to its native token.
Those fundamentals distinguish TRX from assets whose demand depends more heavily on speculative trading.
Yet recent supply expansion demonstrates that high network activity does not automatically produce deflationary tokenomics.
The daily chart presents a separate concern. Price momentum remains subdued, and the convergence of major moving averages offers little confirmation of a renewed upward trend.
Sun’s optimism about 2027 therefore rests on a longer-term proposition: that TRON’s practical utility can continue supporting demand for TRX despite changing market conditions and ongoing token issuance.
The network’s settlement activity provides a credible economic foundation for that argument. Whether it translates into sustained price appreciation remains unproven.
The post Justin Sun Backs TRX Outperformance Despite Mixed Price Signals appeared first on ETHNews.



 (@justinsuntron)