KAITO is trading with $1.14, as traders search for the next move after one of the sharpest run-ups in the token's history. Data source: coinmarketcap.com Any current KAITO price prediction ha
KAITO is trading with $1.14, as traders search for the next move after one of the sharpest run-ups in the token's history.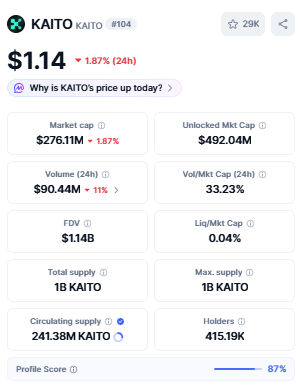
Data source: coinmarketcap.com
Any current KAITO price prediction has to account for a chart that has gone from a multi-month downtrend to a 120.70% monthly gain, alongside a derivatives market that's showing early signs of hesitation even as spot price holds up.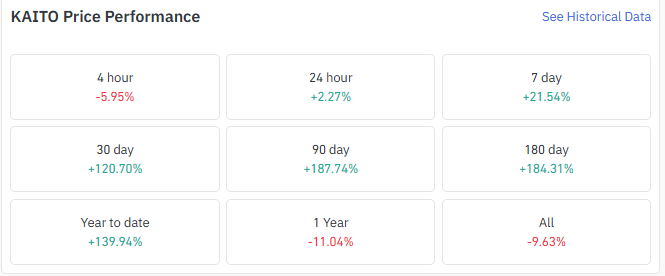
Over the past 24 hours $KAITO is up 2.27%, though the 4-hour window shows a 5.95% pullback, hinting at short-term profit-taking inside a much larger uptrend.
The broader numbers tell the real story. $KAITO is up 21.54% over the past 7 days, 120.70% over 30 days, 187.74% over 90 days, and 184.31% over 180 days.
Year-to-date the token is up 139.94%. Zoom out to a full year, though, and $KAITO is still down 11.04%, and down 9.63% over its entire trading history.
Remember even after this surge, the token hasn't fully recovered from its earlier decline.
What Does the Daily Chart Show for KAITO?
The daily chart traces a long decline followed by a base and a breakout.
$KAITO spent months sliding beneath a descending trendline, bleeding value until it found support at $0.2847.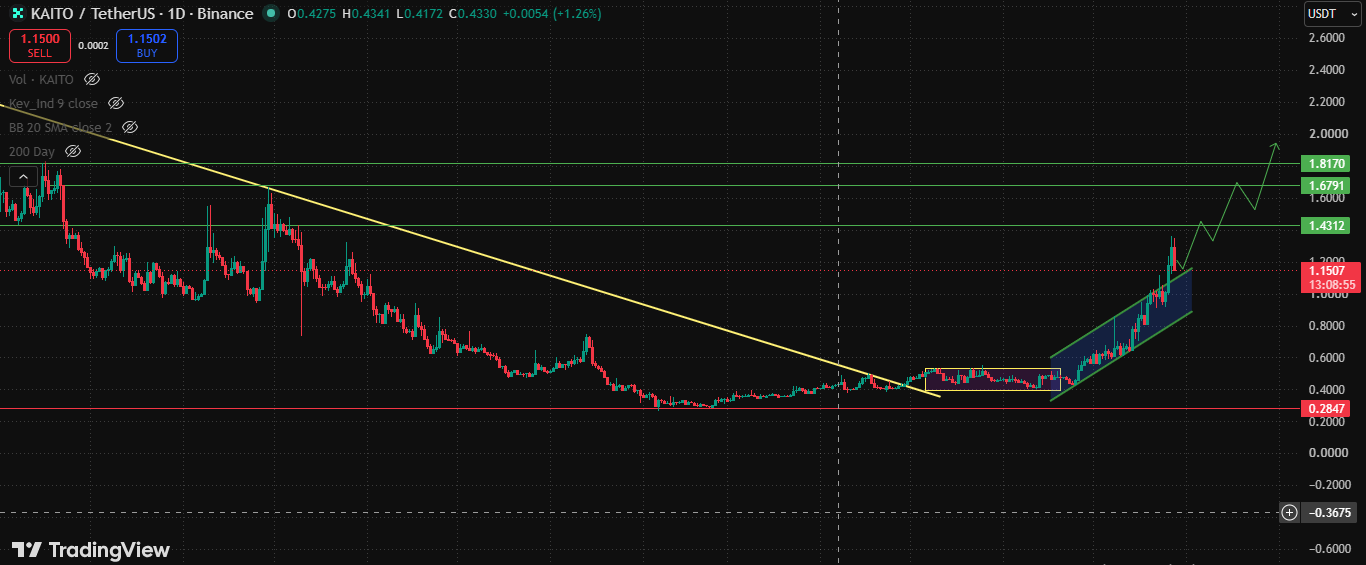
That level held, and price began carving out a sideways structure before breaking above the descending trendline entirely.
From there, the chart shows a shift into an ascending channel, with price accelerating higher through July.
Chart projections extending from that ascending structure point to three levels above current price: $1.4312, $1.6791, and $1.8170.
These aren't targets pulled from momentum or sentiment — they're drawn directly off the channel's trajectory on the chart itself, and price would need to sustain its current trend structure to reach them.
The $0.2847 level, for its part, remains the clearest technical floor below the last major point where sellers lost control and buyers took over.
How Are Derivatives Traders Positioned in $KAITO?
Open interest tells a story of aggressive, recent capital inflow. KAITO futures open interest has climbed from roughly $30M back in March to $178.03M as of July 28, 2026, with the sharpest leg of that increase concentrated in the back half of June and through July right alongside the token's price advance.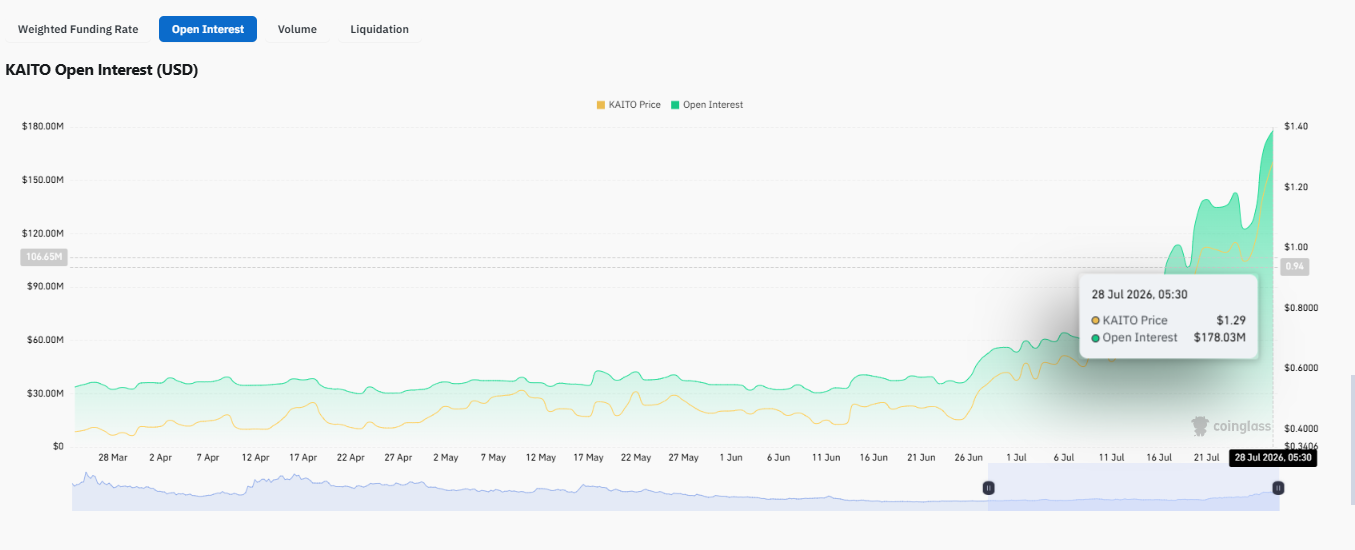
That's a substantial build in leveraged exposure over a short window, and it moved in tandem with spot price rather than against it.
Funding tells a more complicated story. For most of the tracked period, the OI-weighted funding rate stayed consistently positive longs paying shorts which is typical in a strong uptrend.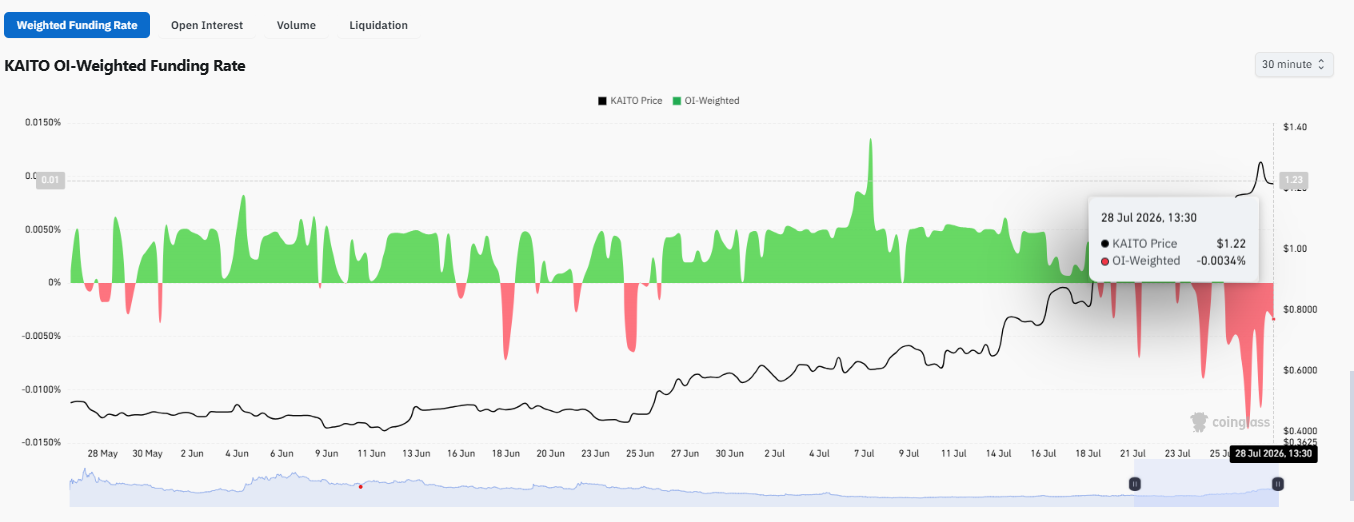
But the most recent stretch, from around July 21 through July 28, shows a cluster of sharp negative funding spikes, including the latest reading of -0.0034% at $1.22.
That's a departure from the pattern that held for months prior, and it suggests short positioning has been building even as price continues to climb.
Positioning data across exchanges is mixed rather than one-directional.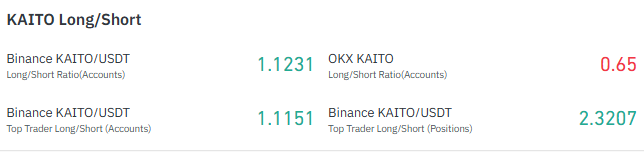
On Binance, the KAITO/USDT long/short ratio by account sits at 1.1231, modestly favoring longs, and the top-trader account ratio is nearly identical at 1.1151. But Binance's top-trader ratio by position size is far more skewed, at 2.3207 meaning the largest positions are heavily long even if the broader account base isn't. On OKX, the picture flips: the long/short ratio there is 0.65, meaning more accounts are positioned short than long.
Taken together, this isn't a uniformly crowded long trade — it varies meaningfully by venue and by trader size.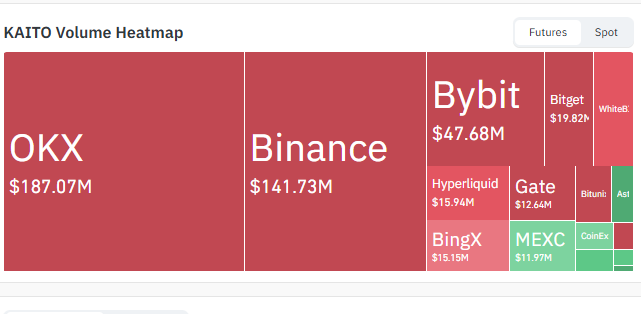
Volume is concentrated on a small number of platforms. OKX leads KAITO futures activity at $187.07M, followed by Binance at $141.73M and Bybit at $47.68M. Bitget ($19.82M), Hyperliquid ($15.94M), BingX ($15.15M), Gate ($12.64M), and MEXC ($11.97M) round out the next tier, with the rest of the market split across smaller venues.
Data Source: coinglass.com
What's Behind the Latest KAITO News?
On July 23, 2026, Kaito AI announced on X that it has entered into a data agreement with X "to power a wide range of use cases," adding that "more coming soon." The post, which had drawn 2.2 million views at last check, was light on specifics no financial terms, product details, or timeline were disclosed.
What is confirmed is that Kaito and X now have a formal data partnership in place, with additional announcements expected.
Beyond the terms stated in the post itself, no further detail about scope or implementation has been made public.
KAITO Price Prediction: What Happens Next?Bullish scenario:
If KAITO holds its current ascending channel structure, the chart's own projected levels at $1.4312, $1.6791, and $1.8170 become the reference points for continuation, in that order. Sustained positive funding returning alongside rising open interest would align with that path, though neither is guaranteed given the recent negative funding spikes.
Bearish scenario:
A break back below the ascending channel would put the $0.2847 support level from the daily chart back in focus as the primary technical floor, though that level sits well below current price and would represent a significant reversal of the recent trend.
The mix of negative funding readings and OKX's short-leaning long/short ratio (0.65) are the type of signals that would need to persist or intensify to support this path.
Neutral scenario:
Continued choppiness such as the 5.95% four-hour pullback within a still-positive 24-hour and 7-day trend would be consistent with consolidation after the 120.70% monthly move, without a decisive break in either direction.
Disclaimer:This article is for informational purposes only and does not constitute financial, investment, or trading advice. Cryptocurrency markets are highly volatile, and prices can change rapidly. All data referenced reflects a specific point in time and may no longer be current. Always conduct your own research and consult a qualified financial advisor before making investment decisions.