Kaspa price has staged an impressive recovery over the past month, and climibed more than 80% and returning above $0.04. KAS is trading around $0.042 on the chart, which puts the token direct
Kaspa price has staged an impressive recovery over the past month, and climibed more than 80% and returning above $0.04. KAS is trading around $0.042 on the chart, which puts the token directly inside an important resistance area after spending much of the summer considerably lower.
The rally naturally raises one big question: has Kaspa finally established its bottom?
Crypto analyst V believes that is now a real possibility. However, his latest chart makes clear that confirmation is still missing, and KAS could face a substantial correction before the answer becomes clearer.
Has Kaspa Price Finally Bottomed?
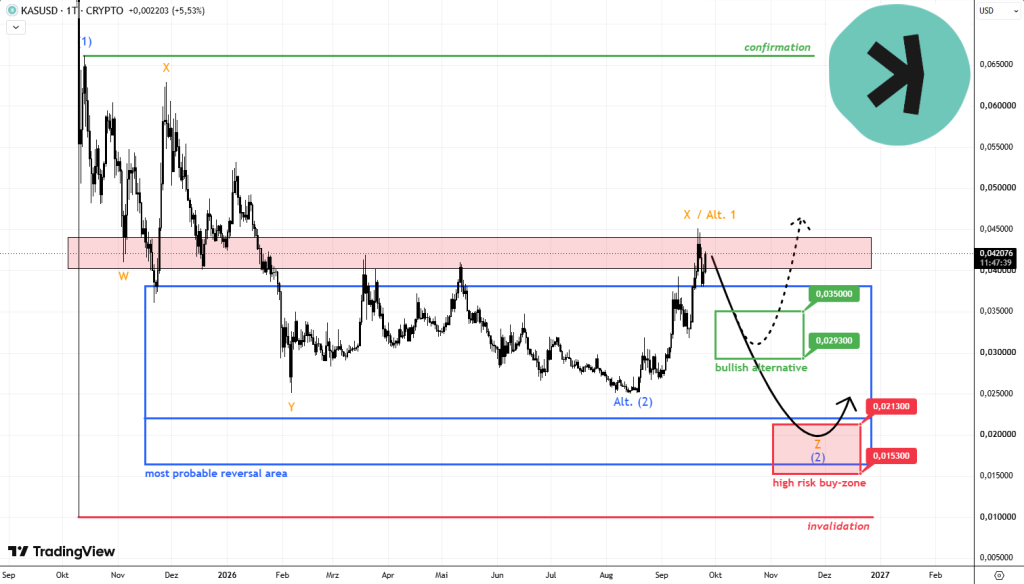
V described the current situation as one of the hardest calls to make. Kaspa’s 80%+ recovery has been strong enough to challenge his previous expectations, but price has now arrived at a major resistance zone around $0.04-$0.044.
The chart shows KAS briefly pushing into and slightly beyond this region before returning toward $0.042. That makes the current area an important test.
V said he thinks Kaspa “might have bottomed,” but stopped well short of calling the bottom confirmed.
His chart actually presents two very different possibilities for what happens next.
The more bullish alternative involves KAS correcting from current resistance but finding support considerably above its previous lows. V marks approximately $0.0293-$0.035 as the key zone for this scenario.
If Kaspa falls into that area and produces a constructive correction, his dotted projection shows price potentially turning higher again and eventually returning toward approximately $0.045-$0.046.
 Source: X/@finsends
Such a move would provide evidence that the recent 80% rally was more than a temporary rebound.
KAS Could Still Face a Much Deeper Correction
The catch is that V’s original expectation has not disappeared.
His primary path shows Kaspa falling substantially from the current resistance area before establishing a more convincing bottom. The analyst marks $0.0153-$0.0213 as a “high risk buy-zone” and says his main expectation had long been for KAS to reach below $0.0213.
Recent price action has made him less certain that this lower region will actually be reached.
Still, the downside shown on the chart is considerable. A decline from approximately $0.042 to $0.0213 would represent a drop of roughly 49%. Reaching $0.0153 would amount to a decline of approximately 64%.
The chart labels the broader $0.015-$0.038 area as the “most probable reversal area,” with the deepest red zone representing the higher-risk portion of that range.
V also places his broader invalidation near $0.01.
This makes the next Kaspa correction particularly important. Rather than assuming the 80% rally confirms a new uptrend, the analyst wants to see how KAS behaves when sellers regain control.
A correction that holds around $0.029-$0.035 would fit his bullish alternative considerably better. A much deeper decline could instead keep the possibility of another lower low alive.
Read also: Kaspa Price Is Waking Up, But Much More Upside Could Be Ahead
The Level That Would Confirm the Kaspa Bottom
Interestingly, neither $0.04 nor $0.05 would provide V with definitive confirmation.
His chart places the critical confirmation level above approximately $0.066. According to the analyst, KAS would need to move above this area in an impulsive manner before the bottom could be treated as genuinely confirmed under his analysis.
That represents another roughly 57% advance from the $0.042 area.
Until then, V believes there is still “a big amount of guess work” involved.
The analyst also warned that upside potential across the broader crypto market may be decreasing as the probability of another larger correction rises. If such a market-wide pullback arrives, he believes Kaspa’s reaction could provide the information needed to distinguish between his two scenarios.
That leaves KAS at an unusually important point.
The token has already delivered an 80%+ recovery and reached major resistance, giving bulls reason to believe the worst may be over. But the chart leaves open everything from a relatively controlled pullback toward $0.029-$0.035 to a much more painful decline below $0.0213.
For V, the next correction could provide the answer. Holding the higher support zone would strengthen the case that Kaspa has already bottomed, while a deeper decline would keep his original lower-low scenario on the table. The strongest confirmation, however, would only arrive if KAS eventually pushes above roughly $0.066 with the impulsive price action the analyst is looking for.
For more crypto news and price predictions, click here.
Subscribe to our YouTube channel for daily crypto updates, market insights, and expert analysis.
The post Kaspa Price Could Face a Brutal Correction Before Its Next Big Move! appeared first on CaptainAltcoin.