Kaspa price prediction August 2026 is drawing fresh attention as KAS approaches a critical juncture on both daily and weekly charts. After months of pressure along a long-standing descending
Kaspa price prediction August 2026 is drawing fresh attention as KAS approaches a critical juncture on both daily and weekly charts.
After months of pressure along a long-standing descending trendline, buyers have started pushing back, and the coin recently attempted its first real breakout move.
Traders are now watching closely to see whether this strength holds or fades back into the broader downtrend that has defined Kaspa price action for most of the year.
Kaspa Price Today: Live Data and 24-Hour Change
KAS/USDT is trading at $0.02732 at the time of writing, down 0.96% over the last 24 hours on the Binance perpetual chart.
Kaspa's market cap currently stands near $754.21 million, while 24-hour trading volume sits around $4.71 million, down 6.32% from the previous session.
The volume-to-market-cap ratio of 0.606% points to relatively thin near-term participation.
Kaspa's fully diluted valuation is close to $784.04 million, with a circulating supply of 27.61 billion KAS against a max supply of 28.7 billion KAS. Source: CoinMarketCap Data checked August 1, 2026, 09:42 IST.
On-Chain and Fundamental Drivers
On the network side, thekaspa blockchain explorer shows Kaspa has processed more than 2,373 million total transactions across 501,383,559 blocks, reflecting the strength of its blockDAG architecture and near instant 0.1 second average block time.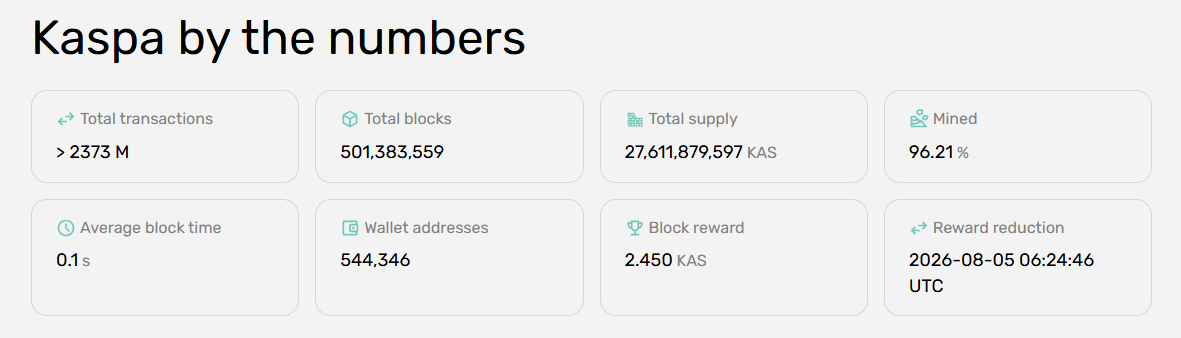
Wallet addresses have grown to 544,346, and 96.21% of the total 27,611,879,597 KAS supply has already been mined.
The current block reward stands at 2.450 KAS, and the next scheduled reward reduction is due on August 5, 2026, a scarcity event worth watching alongside this Kaspa price prediction for August 2026. Source: Kaspa Explorer, checked August 1, 2026.
Quick Take
CMP: $0.02732
Daily bullish trigger: close above $0.02983 → targets $0.03485, $0.04099
Daily bearish failure: close below $0.02654 → targets $0.02493, $0.02202
Weekly bullish trigger: close above $0.04196 → targets $0.05591, $0.07292, $0.13177
Daily RSI: 41.28 (mild bullish divergence forming)
Weekly RSI: 38.66 (mild bullish divergence forming)
Data timestamp: August 1, 2026, 09:42 IST
Note: the daily levels above come from the 1D intraday chart and should be rechecked if the price closes beyond the $0.02654 to $0.02983 range.
Kaspa Price Prediction August 2026: Technical Forecast
On the daily timeframe, KAS/USDT has respected a descending trendline since May 2026. The first tap near $0.04099 triggered a sharp fall, and the second tap around $0.03485 created a fresh lower low as sellers stayed in control. 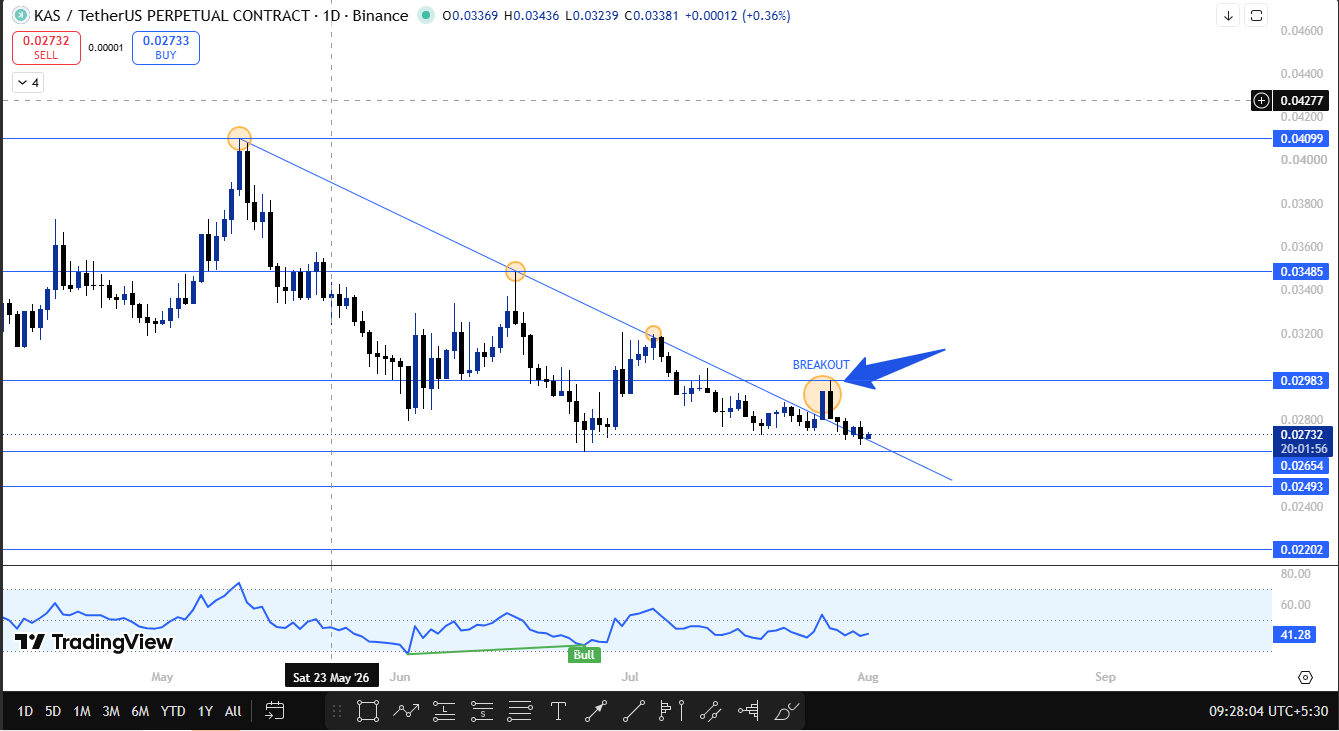
By the third tap, near $0.02983, selling pressure had visibly weakened, and KAS has not printed a new lower low since.
Price has also made one breakout attempt against this trendline already. Source: TradingView chart, KAS/USDT 1D, checked August 1, 2026.
If KASPA breaks and closes above $0.02983, the next resistance zone to watch sits at $0.03485, followed by $0.04099.
A close below $0.02654 would mark a failed breakout attempt, opening the door toward support at $0.02493 and then $0.02202.
The weekly chart tells a similar story. KAS/USDT has been respecting the same style of descending trendline, and the second tap on this timeframe also produced a fresh low.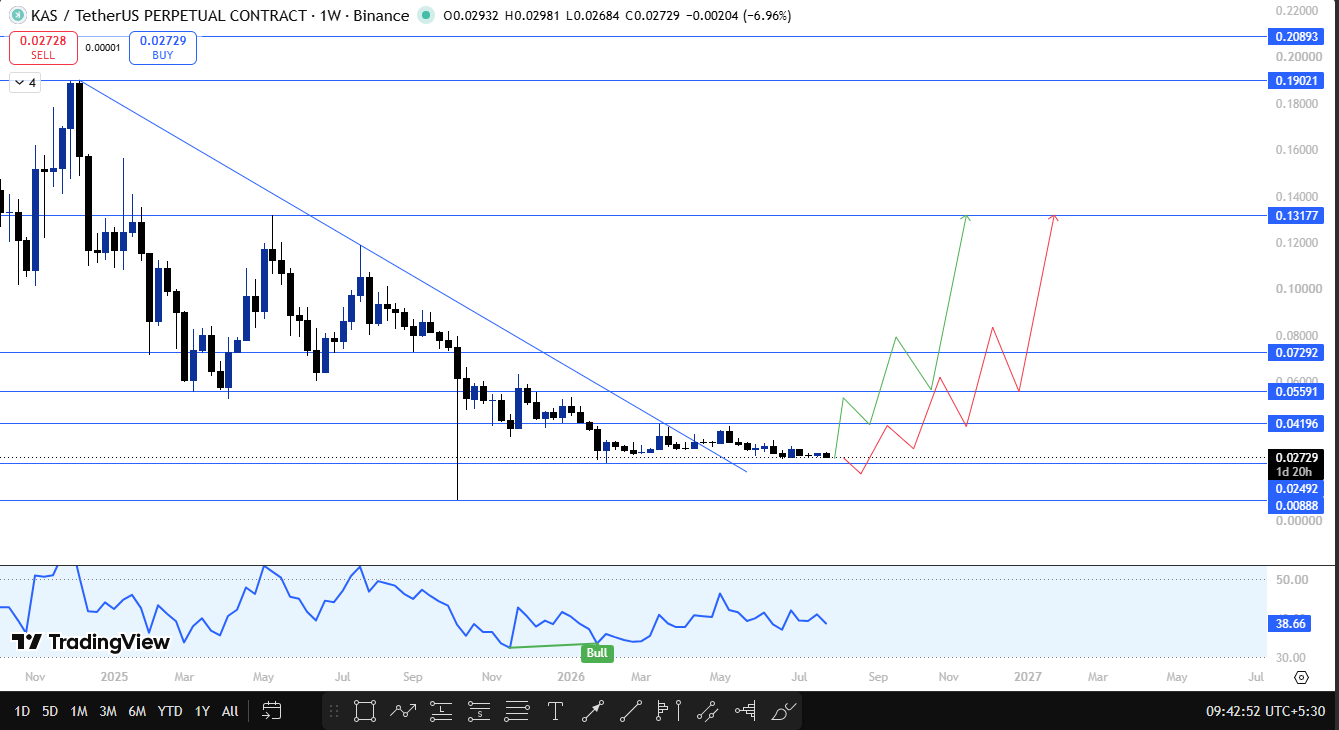
At the third tap, the price managed to hold the trendline rather than break down further, and it has since delivered a breakout.
Since then, KAS/USDT has been consolidating and sustaining above the trendline rather than reversing sharply, a constructive sign for the medium-term Kaspa price prediction 2026 outlook.
If the price breaks and closes above $0.04196 on 1W basis, the next resistance levels come in at $0.05591, $0.07292, and $0.13177. And if breaks and closes below 0.02492, then the next support is 0.00888.
Support and Resistance Table
Timeframe
Level Type
Price
Note
Daily
Resistance 1
$0.02983
Breakout trigger level
Daily
Resistance 2
$0.03485
Prior to the tap on the trendline
Daily
Resistance 3
$0.04099
First trendline tap origin
Daily
Support 1
$0.02654
Breakout failure level
Daily
Support 2
$0.02493
Next support if failed
Daily
Support 3
$0.02202
Extended downside support
Weekly
Resistance 1
$0.04196
Weekly breakout trigger
Weekly
Resistance 2
$0.05591
Next weekly target
Weekly
Resistance 3
$0.07292
Extended weekly target
Weekly
Resistance 4
$0.13177
Long-term weekly target
Weekly
Support 1
$0.02492
Recent swing low
Weekly
Support 2
$0.00888
Structural low
Bull, Base, and Bear Case
In the bull case, $KAS closes daily above $0.02983 and follows through toward $0.03485, with an extended move opening the path to $0.04099.
A confirmed weekly close above $0.04196 would strengthen this case further and put $0.05591 and eventually $0.07292 into view.
In the base case, KASPA continues to consolidate between the $0.02654 support and $0.02983 resistance zone on the daily chart, mirroring the sideways sustaining behavior already visible on the weekly timeframe after its recent breakout.
In the bear case, a daily close below $0.02654 would flag the recent breakout attempt as failed, and KAS could slide toward $0.02493 with further downside risk toward $0.02202 if selling pressure returns.
In the bear case, 1W close below $0.02492 has a downside risk toward $0.00888 if selling pressure returns.
Catalysts to Watch
Several factors could influence Kaspa price action through August 2026.
The upcoming block reward reduction on August 5, 2026, trims new KAS issuance and has historically coincided with renewed price interest around similar supply events.
Speculation aroundthe KASPA listing on Binance has also kept trader attention on KAS.
Momentum from the AI and blockDAG narrative, covered in the KAS listing rumors and AiFi narrative discussion, could add fresh volume if it gains traction.
Broader crypto news coverage is worth tracking for any sudden listing or macro headlines that could move KAS quickly.
Analyst outlook
Market sentiment around Kaspa remains cautiously mixed heading into August 2026.
Some traders see the recent weekly breakout as an early signal that the multi-month downtrend may be losing steam, while others prefer to wait for a confirmed daily close above $0.02983 before turning more constructive.
For broader context on how KAS is being framed alongside other large-cap alternative coins, ongoingtop crypto picks coverage offers additional perspective on shifting sentiment.
Long-Term Outlook
Beyond August 2026, Kaspa's long-term prospects continue to hinge on its block-dAG scaling narrative and whether transaction growth and wallet adoption keep pace with new supply entering circulation.
With mined supply already above 96%, upcoming reward reductions will matter more for scarcity dynamics, and a sustained reclaim of the weekly descending trendline could set the stage for KAS to revisit the $0.05591 to $0.13177 range over coming quarters, though this needs confirmed higher timeframe closes rather than short lived spikes.
Investors weighing Kaspa's volatile swings against other high-beta plays may find the Kaspa GME footsteps analysis useful added context, and readers tracking multiple coins can browse the fullprice prediction hub for more forecasts.
Risks
Key risks to this kaspa price prediction 2026 outlook include a broader crypto market pullback, thin 24 hour volume relative to market cap which can amplify volatility, and the possibility that the recent weekly breakout turns out to be a temporary relief move rather than a genuine trend change.
A daily close back below $0.02654 would be the clearest early warning sign that downside risk is building again.
How to Buy and Store Kaspa
KAS can be bought on major centralized exchanges that list Kaspa spot and perpetual pairs, typically by funding an account, completing verification, and swapping stablecoins like USDT for KAS.
For longer-term holding, moving KAS off the exchange into a non-custodial wallet that supports the Kaspa network is generally considered safer than leaving funds on an exchange.
Always verify wallet addresses directly through Kaspa network resources before sending funds.
Glossary
Descending trendline: A downward-sloping line connecting successive lower highs, used to track resistance in a downtrend.
Breakout: A price move that closes beyond a key trendline or resistance level, often signaling a potential trend shift.
RSI (Relative Strength Index): A momentum indicator measuring the speed and size of recent price moves, typically read on a 0 to 100 scale.
Support and resistance: Price zones where buying or selling pressure has historically been strong enough to pause or reverse a move.
Bullish divergence: When price makes a lower low but a momentum indicator like RSI does not, hinting at weakening downside momentum.
Disclaimer
This article is for informational purposes only and should not be considered financial or investment advice. Cryptocurrency markets are highly volatile, and prices can change rapidly. Always do your own research and consult a qualified financial advisor before making any investment decisions.